Improving Email Performance - A Guide for Multifamily Executives

Improving Email Performance - A Guide for Multifamily Executives

Optimizing Performance

Introduction

There is a growing trend across industries to prioritize Business Intelligence, or using data to inform, enhance, and optimize performance. Data drives every major part of business; therefore, it’s crucial to utilize it.


What You Will Learn

In this guide, you will learn how to use the data from email reports to optimize:

  • Open rate
  • Click-through rate
  • Send frequency

This guide is intended for Regional Managers and Marketing Administrators and can be easily adapted for training purposes.
 

How is the Guide Organized?

The guide is structured as follows:

  • Everything You Need to Know about Open Rate
  • Everything You Need to Know about Click-Through Rate
  • How Frequently Should You Send Emails?
  • Optimizing Email Metrics Using Email Reporting

Once you complete this guide you will be able to optimize individual emails and email campaigns across all properties.

Everything You Need to Know about Open Rate

What is Open Rate?

Open Rate (OR) is one of several metrics that reflect the level of engagement prospects have with the content you send them. The higher the OR, the higher the engagement.

Before proceeding, it’s important to define when an email is considered ‘open’. An email is considered ‘open’ only when images are enabled.

Most emails enable images automatically. Sometimes though, users will need to enable images manually. Below you see an example of manually enabling images in Gmail:

Number of Opens

Number of opens is the number of times an individual user opens an email. For example, if a user receives an email and opens it 5 times, then the number of opens is 5.

Unique Opens

Alternatively, ‘unique opens’ is the number of unique people who have opened an email. Again, say a user receives and opens an email and then opens it four more times. The unique open is counted as one, the total number of opens is 5.

How is Open Rate Calculated?

The OR is calculated by the number of people who opened the email divided by the number of people who received the email times 100 to calculate the OR percentage.

For example, if you sent 150 emails and 50 were uniquely opened your OR would be 33% (50/150) * 100.

What is a Good Open Rate?

Open rates depend on several factors; everything from the number of recipients to the subject line can impact the OR, but an OR between 20-40% is considered good.
 

Best Practices to Improve Open Rate

Having the right tools and data is crucial, but you need to know how to use them. In order to improve OR, let’s review OR best practices.

Create Engaging Subject Lines

Subject lines are the difference between a prospect opening your email or not. You should customize your subject line each time you create an email.

Specific vs. Generic Subject Lines

It’s crucial to find a balance when writing subject lines. For example, you wouldn’t want to send a subject line so vague or generic that prospects ignore it: ie. ‘Offer’. Yet, you do not want to overdo the enthusiasm or specificity: ‘Amazing, Outstanding, Special Offer Just For You!’

Balance is key: ‘Don’t Miss this Special Offer!’

Ask Questions

Subject lines as a question can entice users especially if they are relevant. For example, send prospects an Offer with a subject line of: ‘How Much are You Willing to Pay?’

Keep it Personal

People like emails that feel personalized. Simply adding a user’s first name or the date or event where you met the user can go a long way: ie. ‘Hi John, Great Meeting You at the Open House Last Sunday.’

Have a Sense of Urgency

Sometimes you need a subject line with a sense of urgency. The more important and attention-grabbing your email is, the more likely it is to be opened: ‘Act Now!,’ ‘Don’t Miss this Special Offer!’

Be Concise

When you are competing for people’s attention, it’s crucial to keep subject lines concise: ‘Take 50% Off of Your Rent Today!’

Send Emails at the Right Time

Another way to improve OR is by knowing the time of day to send emails. Below you see a graph by Campaign Monitor. They found that the largest percentage of emails are opened around 10am. Therefore, sending emails around 10am should result in a higher OR.

This is a simple change and an example of how better data you can enhance email performance.

Send Emails on the Right Day

In addition to sending emails at the right time of day, you need to send them on the correct day as well.

For example, if you send emails for an event 2 days before the event is scheduled users will likely be unable to attend. You need to allow a longer window for engagement.

Alternatively, you do not want to send an email too far in advance. For example, if you send an event email a month in advance, you will give users time to engage with it; however, too long a window can cause users to disengage and lose interest.

In multifamily, usually, a one-week engagement window is best.

Send the Message via SMS

Finally, consider improving OR by sending your emails as both an email and SMS. SMS have a 98% OR while email has an OR of around 20%.

Check out our comprehensive SMS guide to learn about how SMS can benefit your multifamily business.

Event Email in Email Formatting

Event Email in SMS Formatting

Now that you know how to get users to open your emails, let’s ensure they click through them.

Everything You Need to Know about Click-Through Rate

What is Click-Through Rate?

Click-through rate (CTR) is another metric that reflects prospect and resident engagement. CTR represents how many people clicked on a text link, image link, or CTA in your email.

Number of Clicks

The total number of clicks reflect each time a user clicks on one of the links referenced above. For example, if a user opens your email and clicks on a CTA 5 times, the total number of clicks will be 5.

Unique Clicks

Additionally, ‘unique clicks,’ is really representative of the number of unique people who clicked on a link in your email. For example, if a prospect clicked on a ‘Schedule a Tour’ link multiple times, the unique click for the that link and that user will be one.

How is CTR Calculated?

CTR is calculated by the number of people who clicked a link in your email divided by the number of emails sent.

For example, if you sent 100 emails with a CTA link and 5 recipients clicked on it, your CTR would be 5% for that link – CTR = (5/100) * 100

If that same email contained an image link and only 2 people clicked on it, your CTR would be 2% for the image link – CTR = (2/100) * 100

What is a Good CTR?

Like OR, CTR varies, and much of this variance is due to the number of recipients and how engaging recipients find your email. However, a CTR between 2-5% is considered good.
 

Best Practices to Improve Click-Through Rates

Similar to OR, there are best practices to improving CTR as well.

Optimize Your Message Copy & CTA Copy

Your words matter, and you want to ensure your copy and keywords are relevant.

For example, say you are trying to reach new prospects and decide to run a ‘Half Off Rent’ Offer. With the ability to customize each email, you can ensure this Offer uses the correct copy and keywords in both the message and CTA to engage prospects.

In the image below, you see the Offer. It displays a half-off deal on your first month’s rent. In the body of the message, the Offer points out that moving is pricey but the property wants to help. Finally, the CTA prompts you to schedule a tour. All of the information relates and encourages the prospect to tour.

Relate Your Emails & CTAs

As crucial as it is to relate your message and CTA copy, you want to ensure your email type and CTA match as well.

Consider this, it would be ineffective to have an Offer with a header that reads ‘Half Off Your First Month’s Rent’ followed by a CTA that reads ‘Join Us’.

A CTA of ‘Join Us’ is far more appropriate for an Event email such as Pool Party or even an Open House Offer, which does not require a scheduled tour.

When your email type, message copy, and CTAs relate, prospects and residents are more likely to engage and click through.

Know Your Audience

Finally, you need to know how to communicate with your audience. Consider who your email is intended for. This is especially true for prospects and residents.

In addition to customizing emails, you want to send them to specific groups. This allows you to target a specific audience and center your email, message, and CTA around that group.

For example, you wouldn’t send an email with a ‘Schedule a Tour’ CTA to Brokers. A CTA of that nature is best suited for prospects.

Now that you know how to improve your CTR, you want to ensure you are sending emails consistently.

How Frequently Should You Send Emails?

What Does the Research Say?

Sending emails consistently is crucial to optimizing prospect and resident engagement. However, frequency matters. Sending emails too frequently can quickly result in users’ unsubscribing.

Marketing Sherpa found most people prefer to receive promotional emails at least once a month. The second highest preference is receiving promotional emails at least once a week.

However, there is a lot more to the story.


User Behavior as a Signal for Frequency

There are a number of ways to discern if the frequency at which you send your emails is effective or not:

  • Number of unsubscribes following your email campaign
  • Low OR and CTR
  • Higher OR and CTR (ideal response)

Number of Unsubscribes

While nobody wants their prospects or residents to unsubscribe, this is a good indicator if you are sending emails too often.

In fact, TechnologyAdvice found that 45.8% of people flag an email as spam because the sender sends messages too often:

Another significant reason why users unsubscribe is due to irrelevant content. You’ll notice in the graph above, the third most sighted reason for unsubscribing is due to irrelevant content. In fact, 85% of people surveyed by the DMA (Data & Marketing Association) say that ‘…less than half of the emails they receive are either interesting or relevant.’

In short, sending messages too frequently, especially if they are irrelevant, will result in unsubscribes.

Low Open Rate and Click-Through Rate

You may also find your OR and CTR is very low indicating emails are being sent too frequently.

TechnologyAdvice found that 43.9% of respondents say businesses could improve their email efforts if they simply sent emails less frequently.

High Open Rate and Click-Through Rate

Conversely, High OR and CTR can indicate that consumers find your send frequency acceptable. It may also indicate you are considering other variables that correspond with the send frequency.

For example, you might make it a point to send content that is more informative and more personalized. As noted by the same graph used above, more informative content and more personalized offers are the second and third best ways for businesses to improve email efforts.

Ultimately, you want to ensure your emails resonate with people. Sending an Offer once a month is likely to generate a higher OR and CTR than sending Announcements daily. Again, balance is key.
 

Best Practices to Improve Send Frequency

Much of user send frequency perception relies on:

  • Choice
  • Relevancy
  • Testing

Give Users a Choice

Choice is crucial for email marketing. Not only do you want users to choose to opt-in to email marketing, but also it’s important to offer users a choice regarding send frequency. This can be as simple as having users select if they would prefer emails daily, weekly, or monthly.

Send Relevant Content

As noted above, users want relevant content. They will be more likely to accept your send frequency if they find your content relevant. One way to ensure content is relevant is again through choice. For example, ask users if they would prefer Offers to Announcements.

Test Your Send Frequency

Finally, test your methodology. Try sending an email once every two weeks versus once a week. Then simply pay attention to user behavior following each campaign–unsubscribes, OR, CTR, etc. This gives you an idea if your send frequency is working or if you need to adjust it.

We will discuss this more in the next post–Optimizing Email Metrics Using Email Reporting.

Optimizing Email Metrics Using Email Reporting

Email Reporting Overview

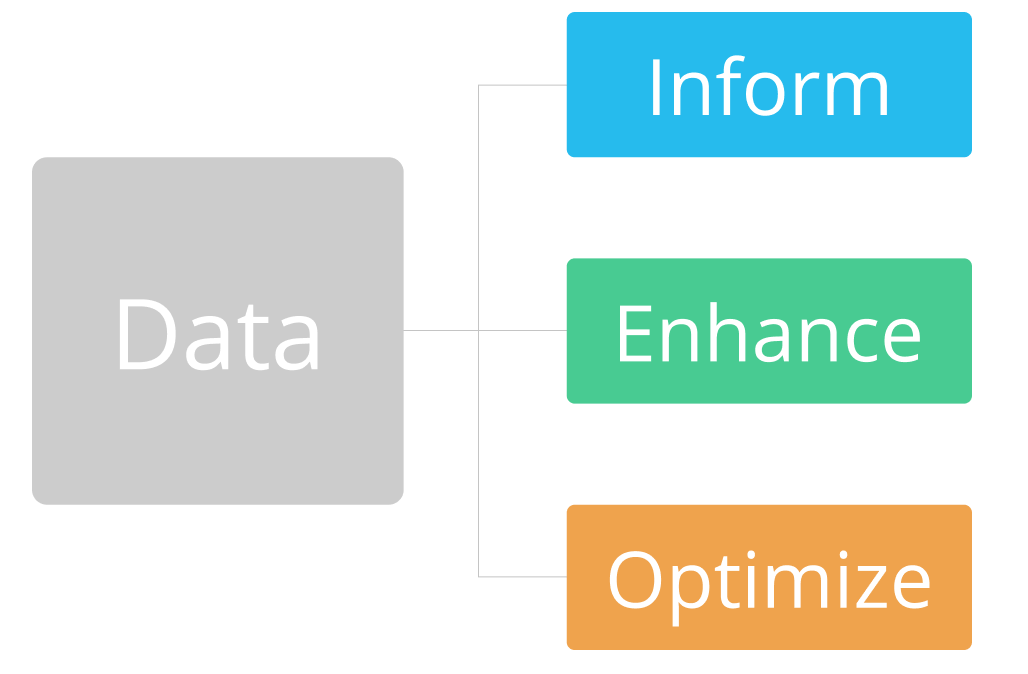
Finally, to improve email performance you need the right data. There are 3 variables you should measure on every email:

  • Sends
  • Open Rate
  • Click-Through Rate

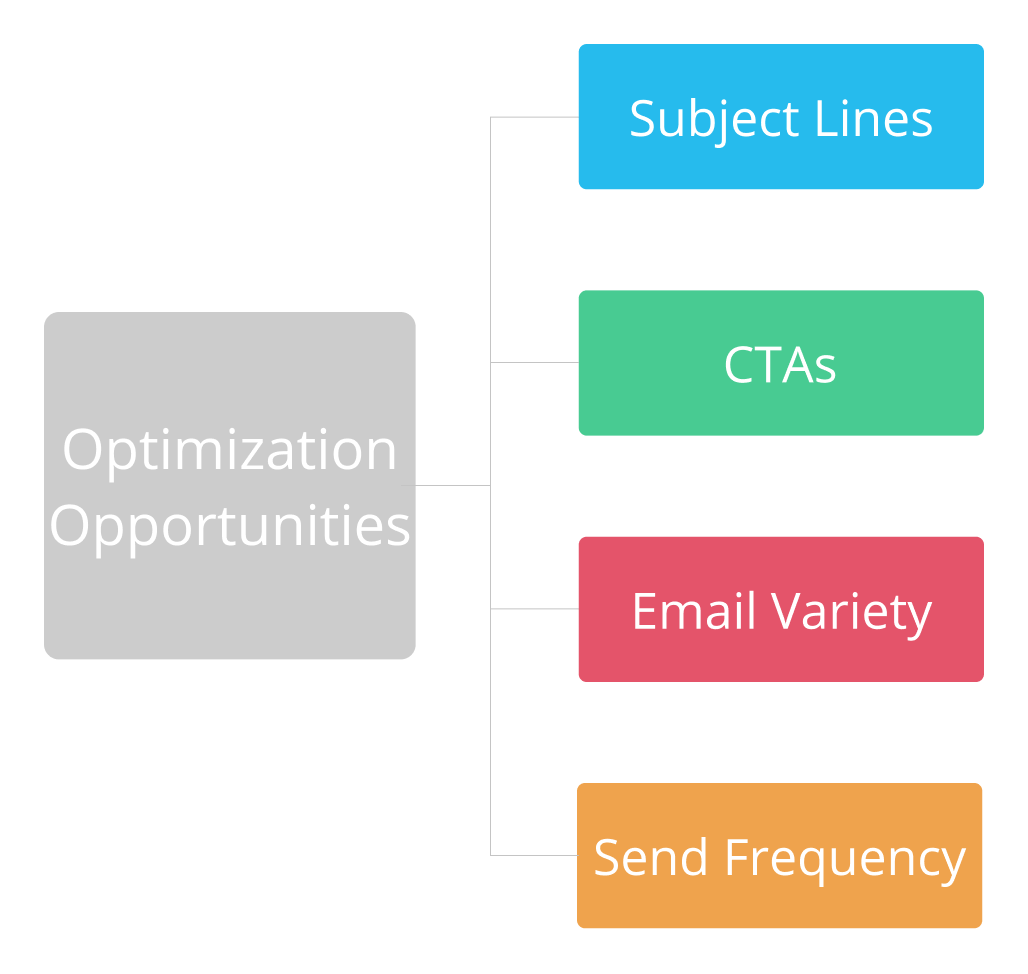
These features allow you to optimize:

  • Subject lines
  • CTAs
  • Email variety
  • Send Frequency

Reporting at Regional and Property Levels

hyMail Blasts, Hyly.AI’s promotional marketing communications app, offers reporting at two levels:

  • Regional level
  • Property level

Regional Level Reporting

In order to access regional reports, you must have multiple properties. Once at the regional level, you can access both of the regional report types:

  • Property Audit Report: Comparing Properties
  • Property eBlasts Reports: Comparing Campaigns

*eBlasts are email campaigns created and sent through the hyMail Blasts app.

Property Audit Report: Comparing Properties

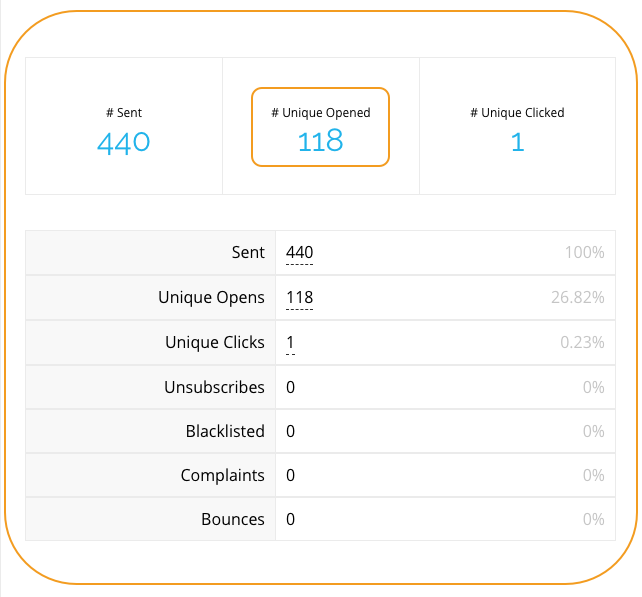
The Property Audit report summarizes email activity for each property. This includes the last date an email was sent, days since the last email was sent, send, opens, and clicks across your portfolio.


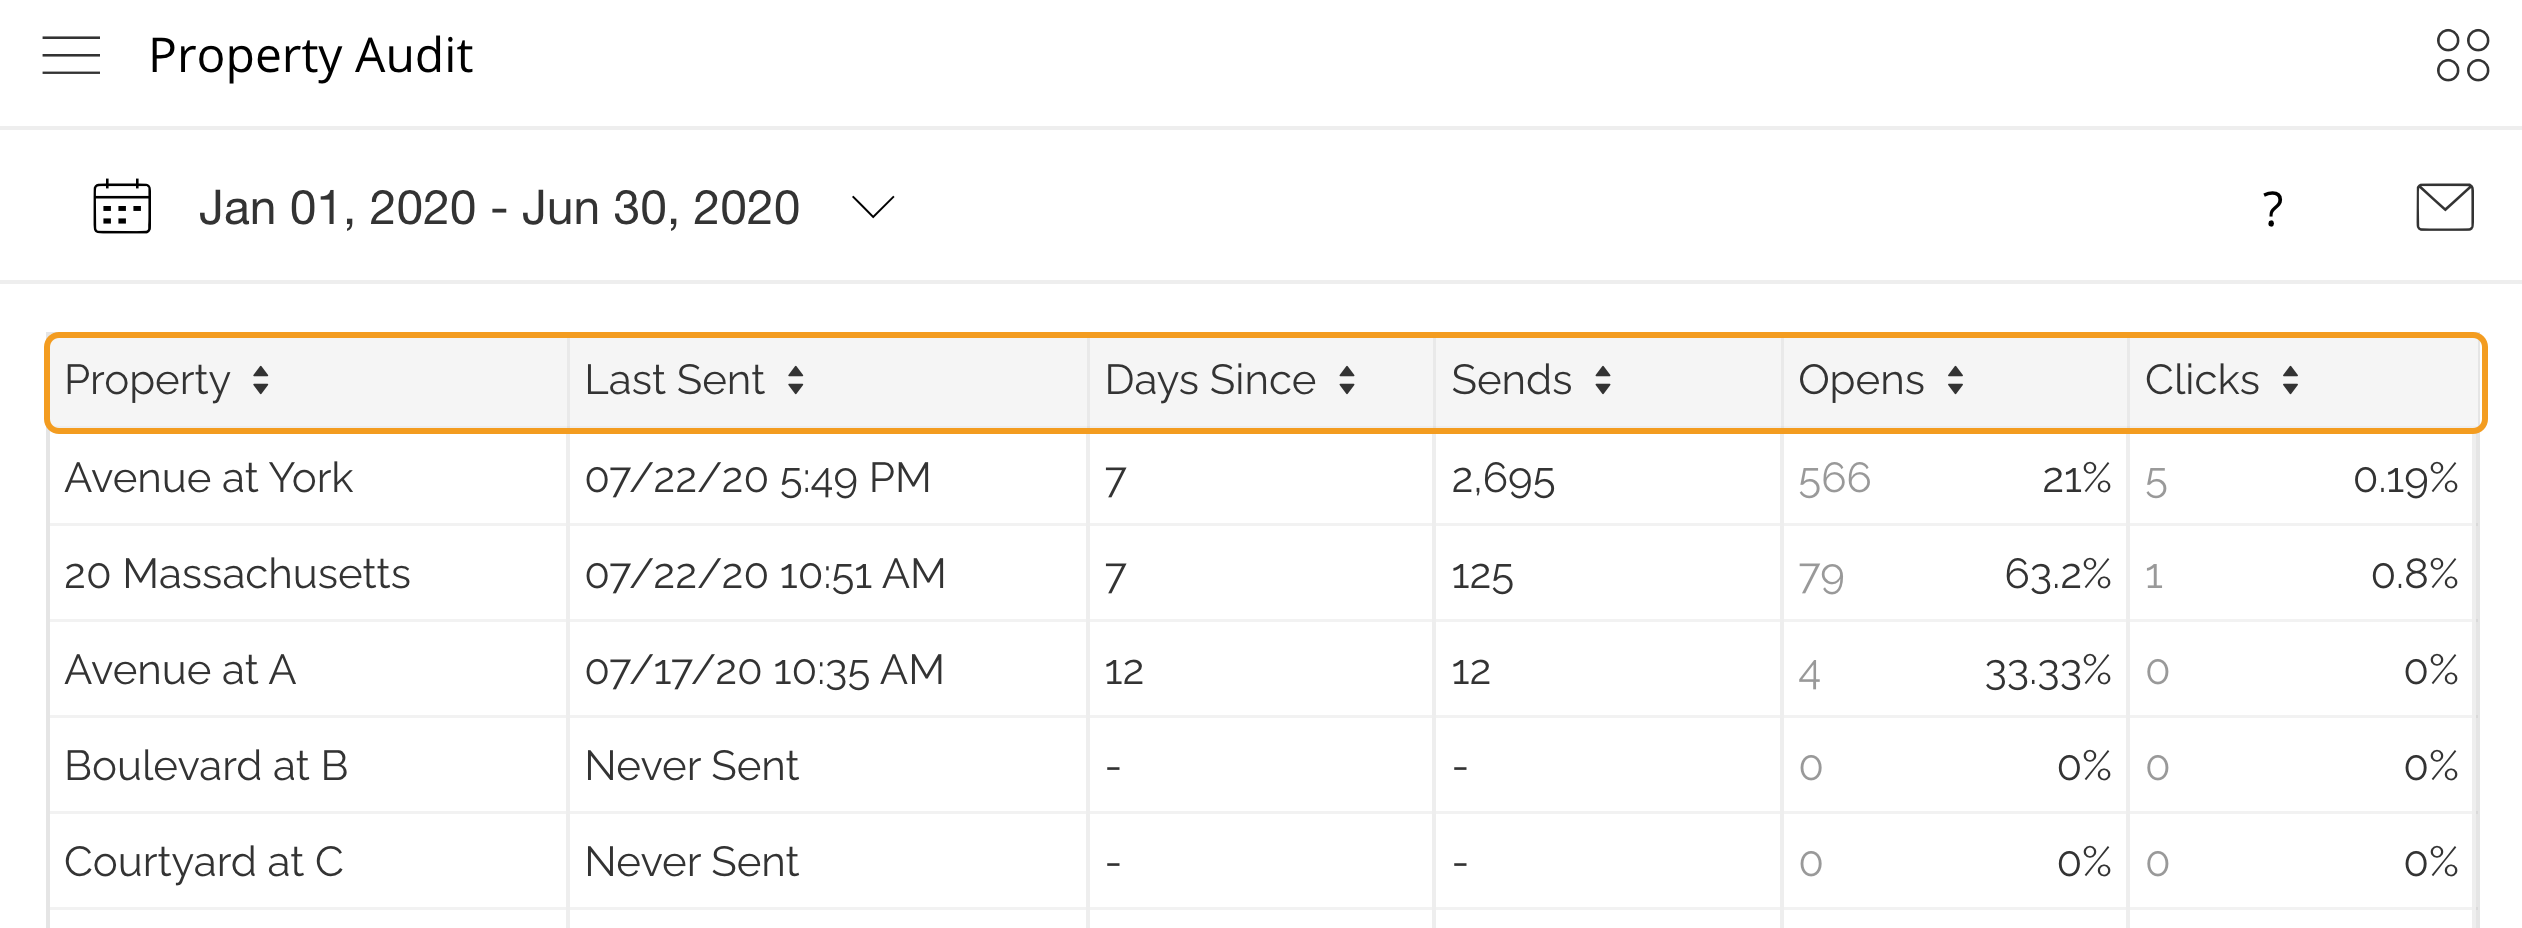
Read more about Property Audit reports.

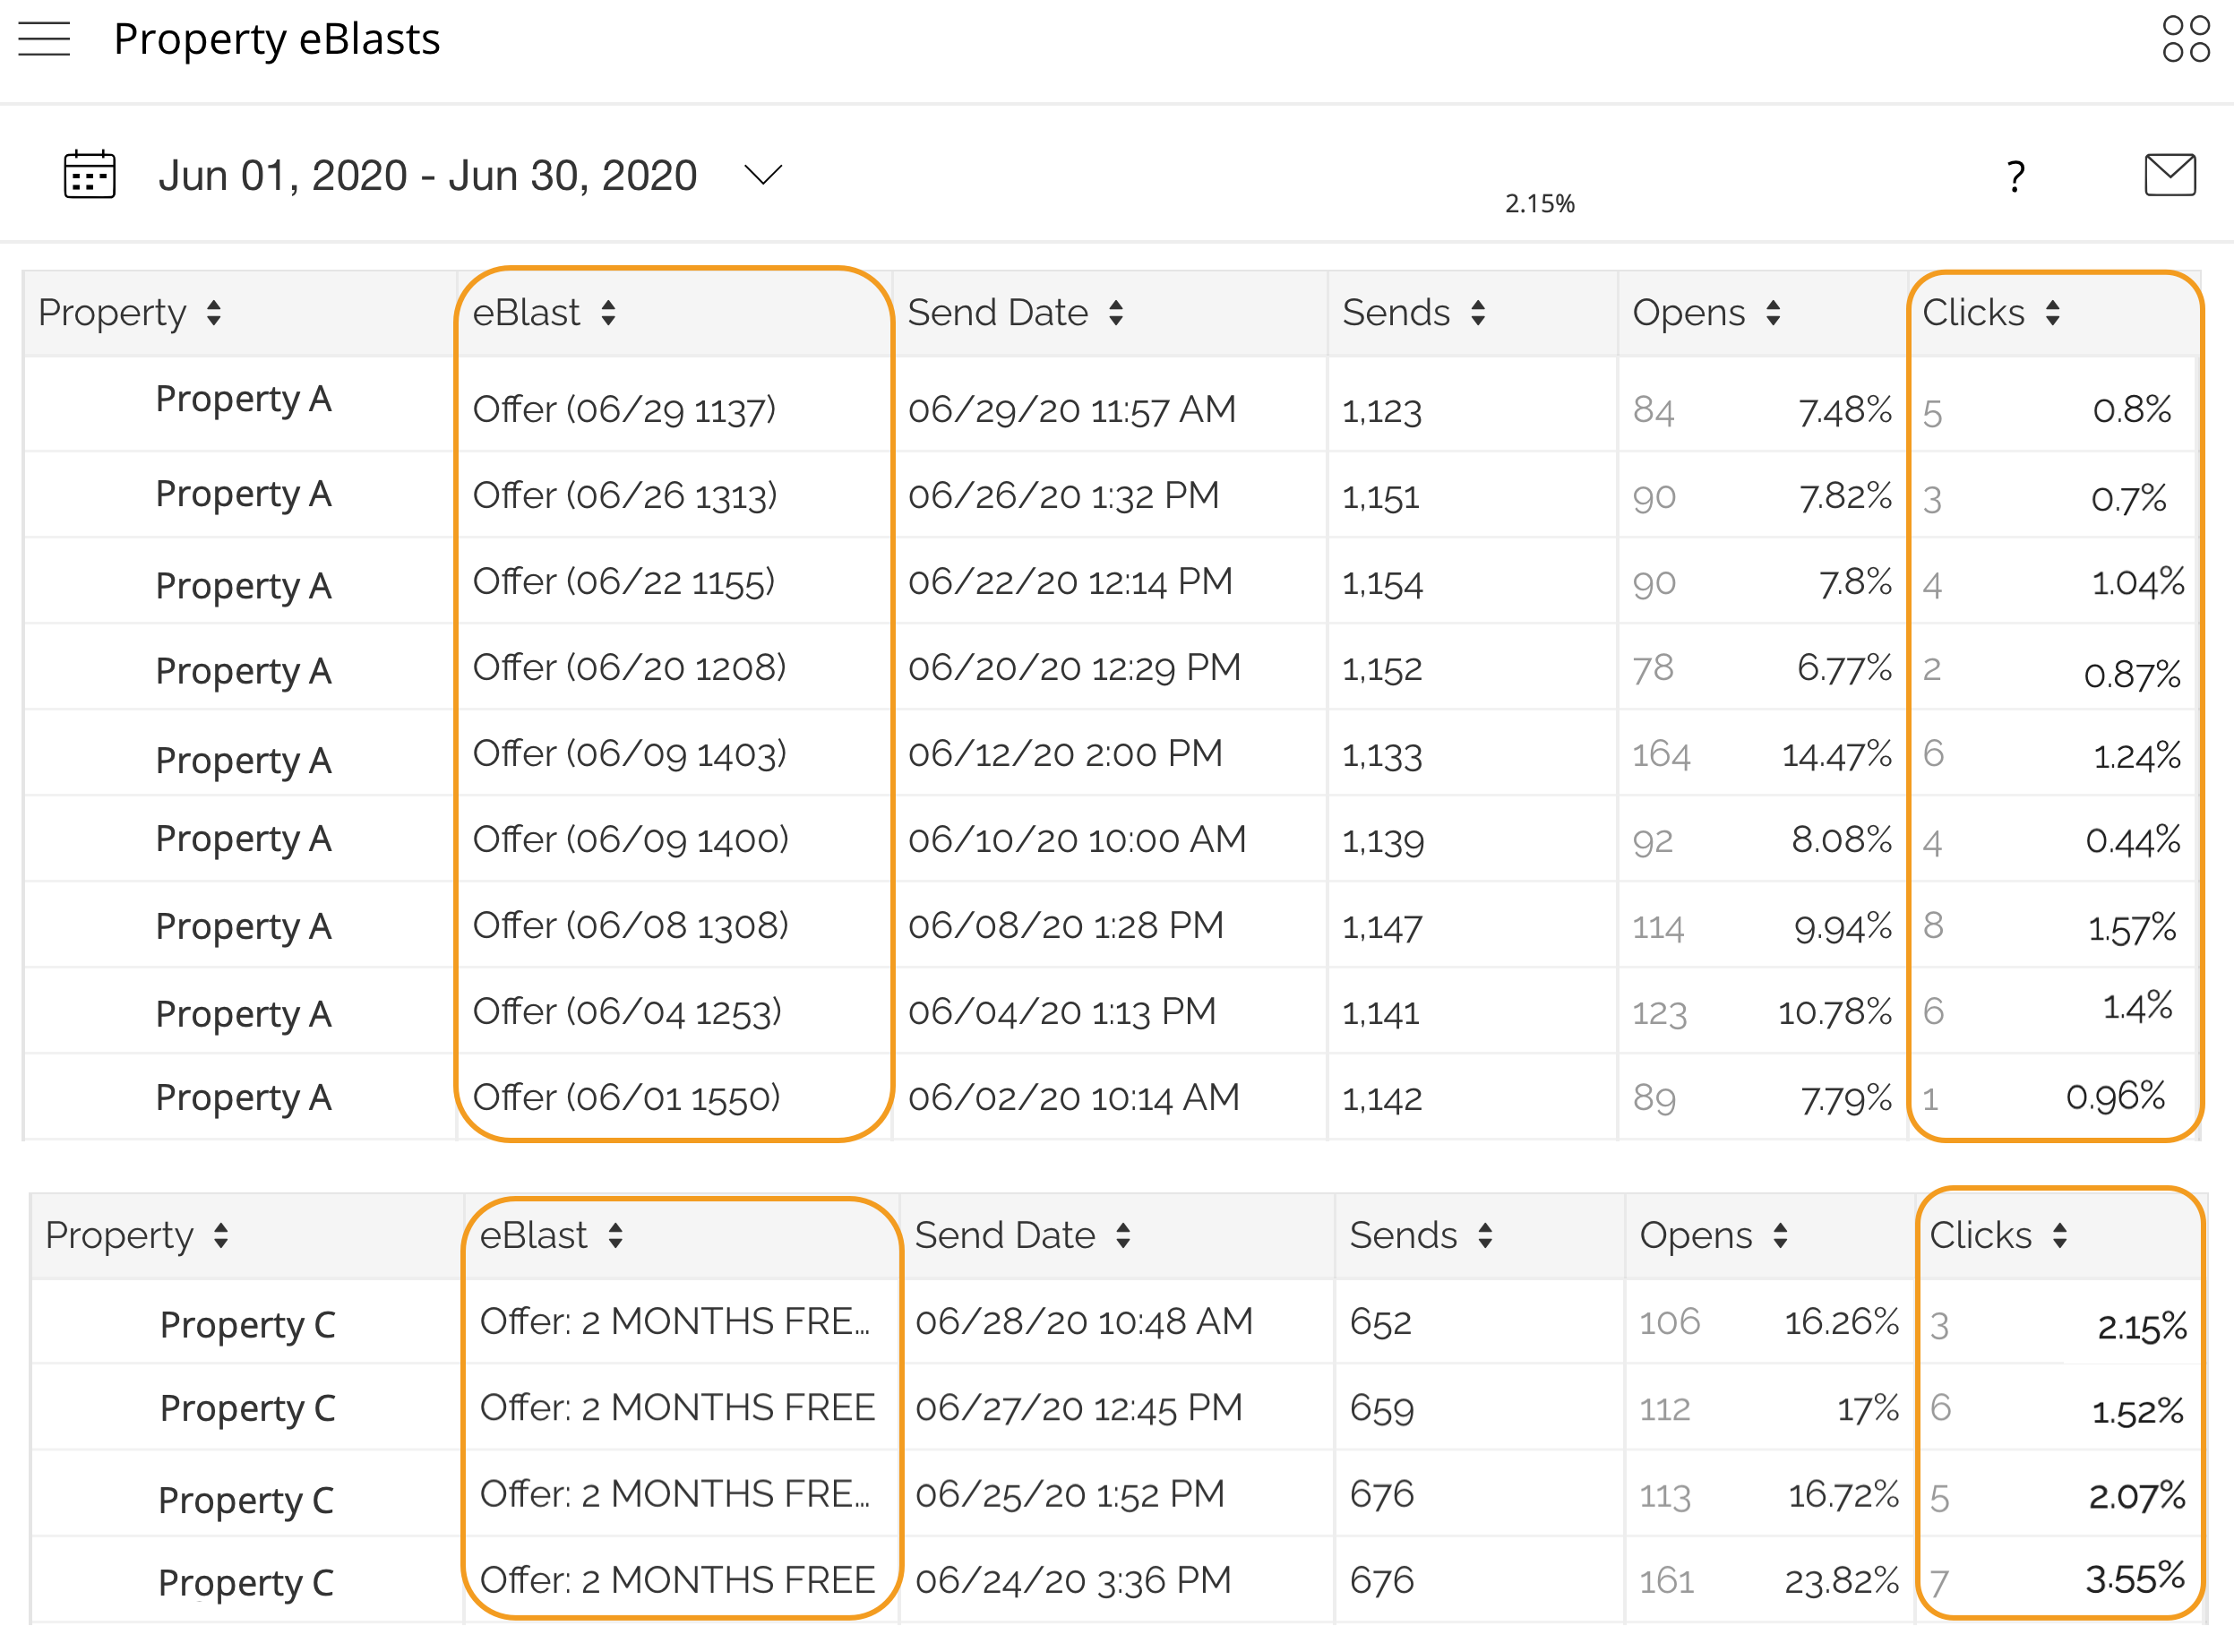
Property eBlast Report: Comparing Campaigns

The Property eBlast report highlights statistics for total eBlasts sent across all properties and a breakdown of each eBlast campaign across your portfolio.


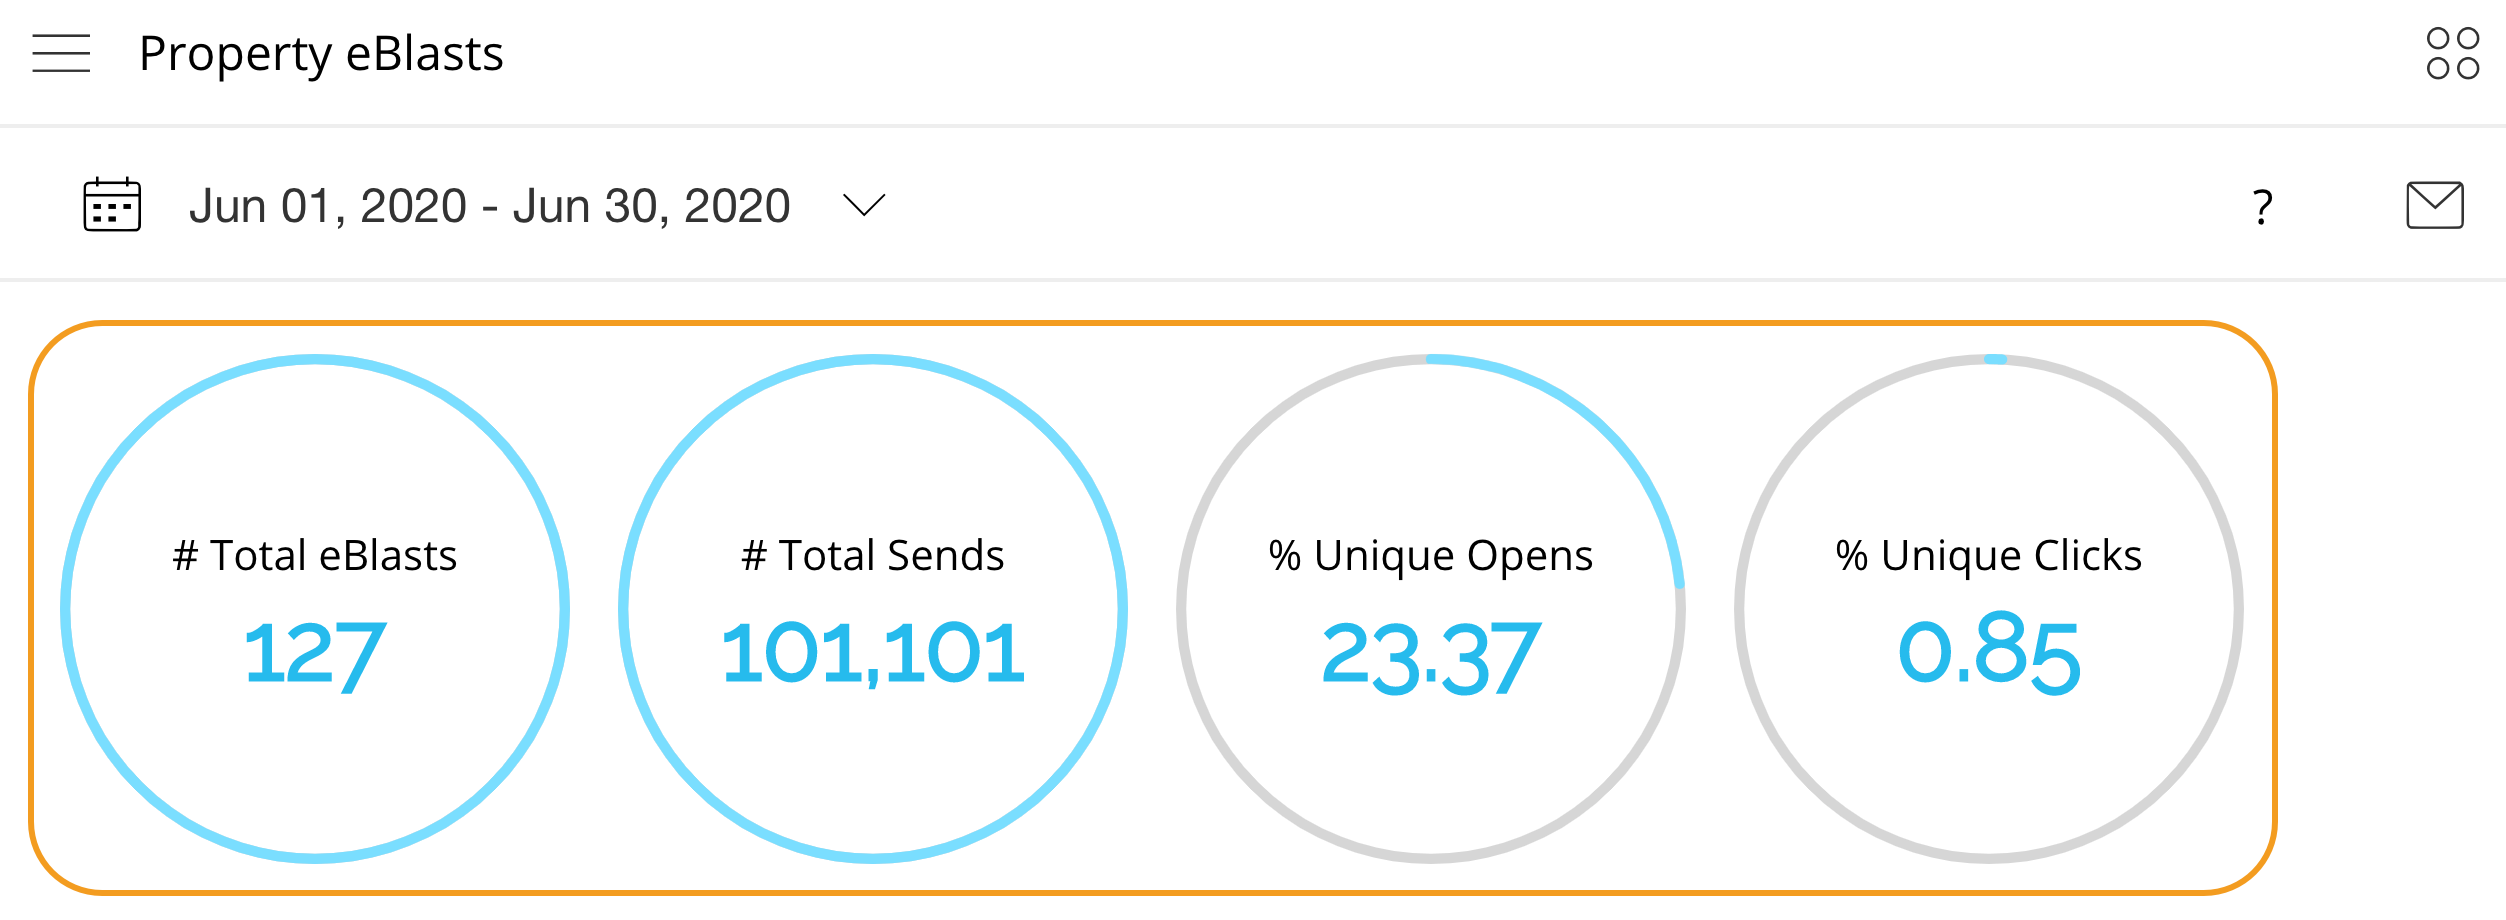
For example, there have been a total of 127 eBlast campaigns sent between June 1 – June 30, 2020.

The other section of the property eBlast breaks down each eBlast campaign:

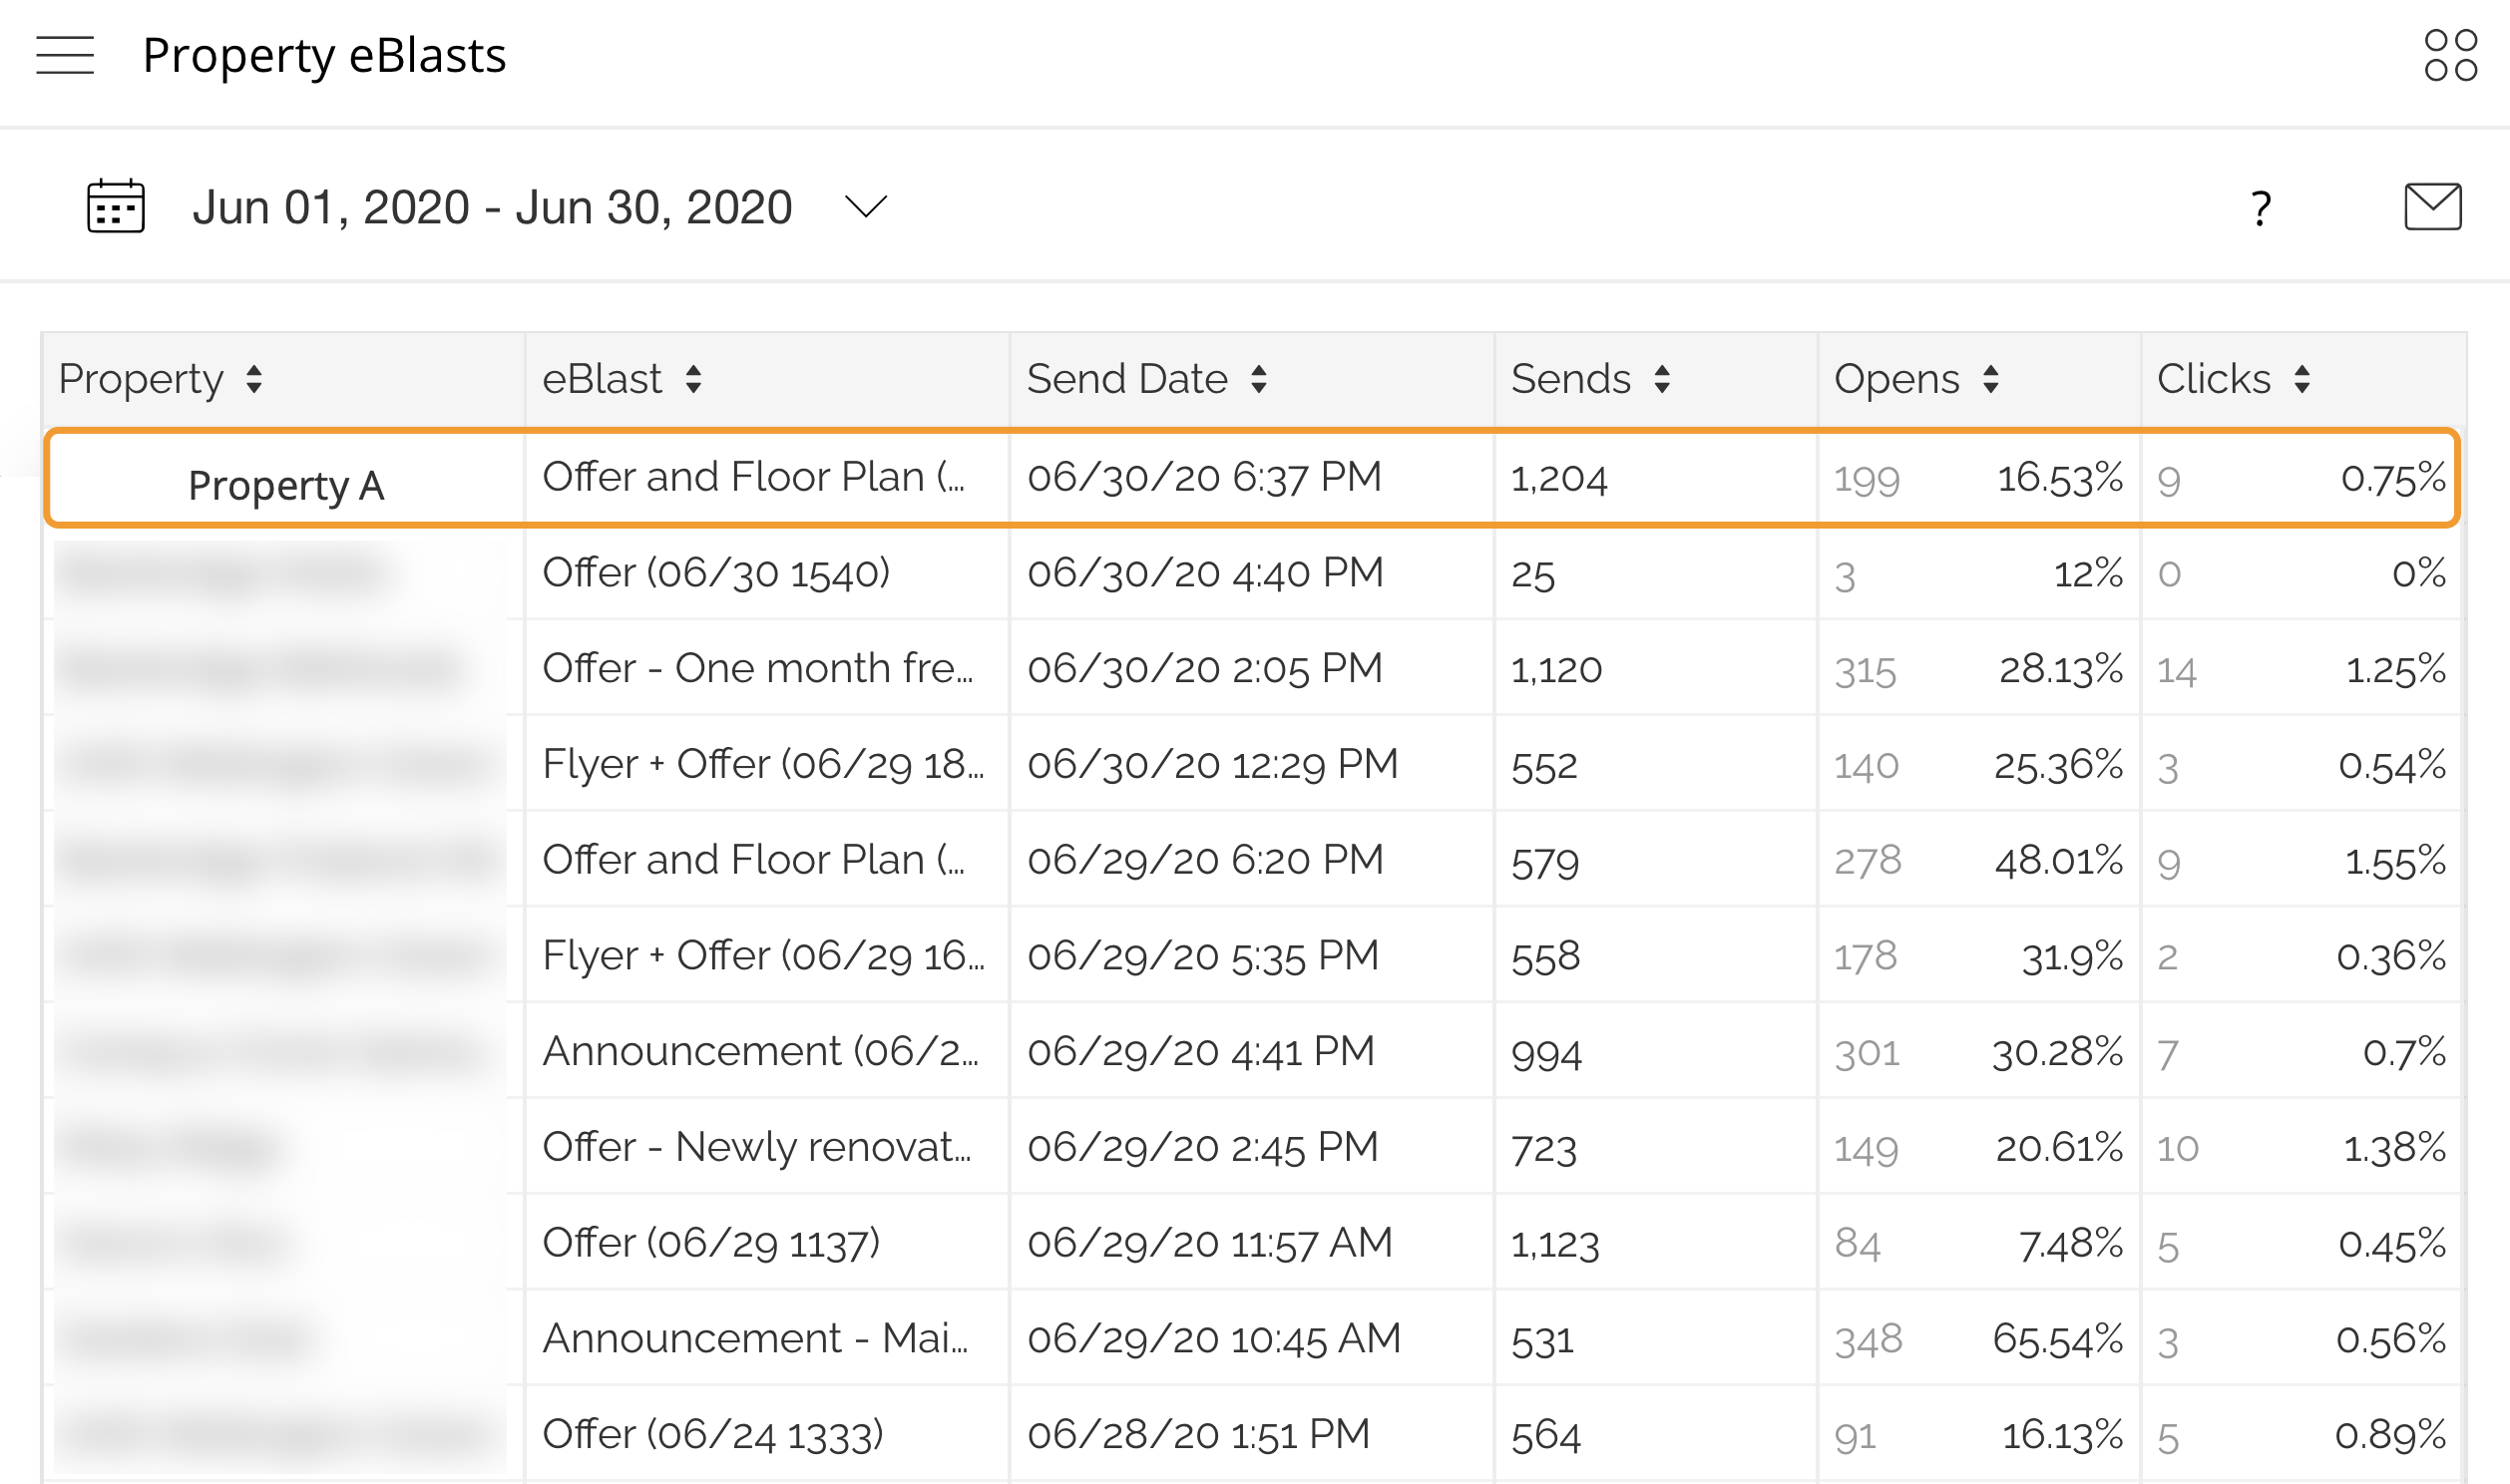
For example, Property A sent an Offer on June 30th to 1,204 recipients.

Read more about Property eBlast reports.

Property Level Reporting

The property level eBlast report focuses on a single property and a single eBlast campaign.

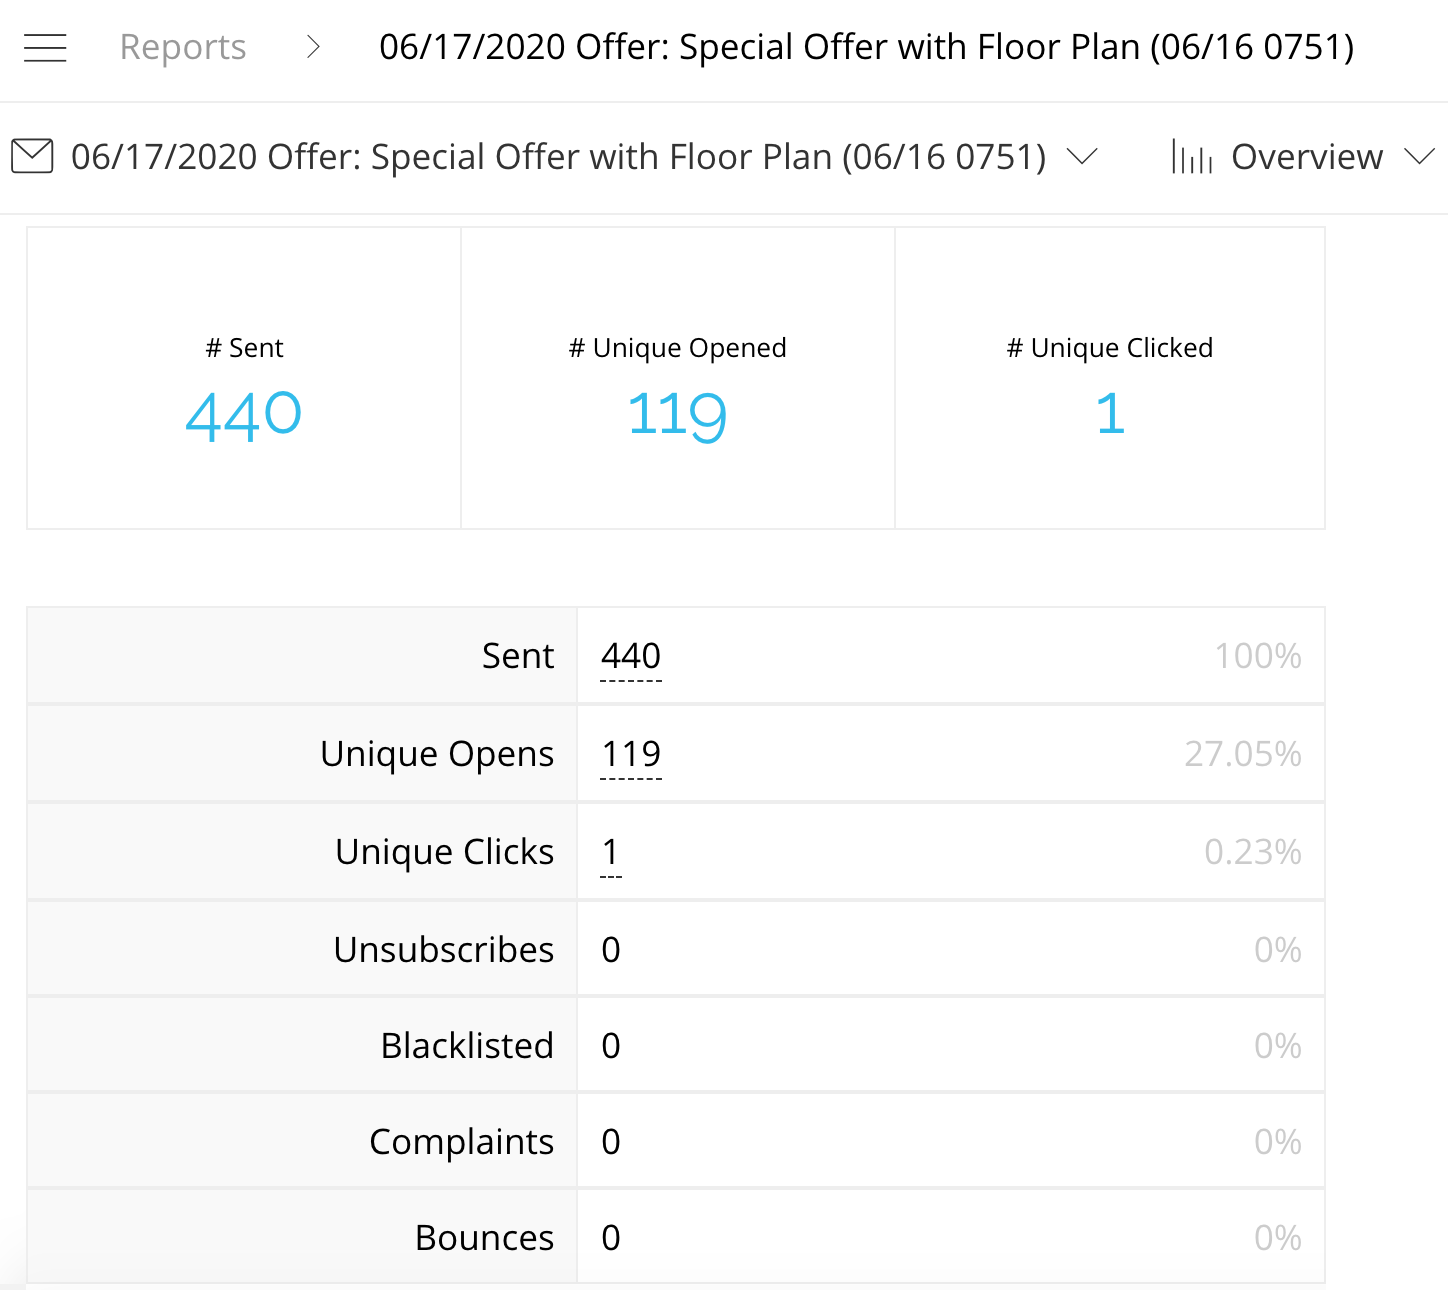
This is different from reports at the regional level, which review data for all properties and all campaigns within a specific date range.

Now that you know how to read the data, let’s review how to apply it.

Read more about property level eBlast reports.

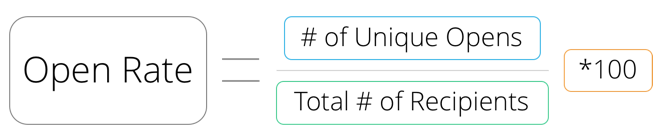
Optimizing Open Rate

Reporting at both the Regional and Property level can inform and improve Open Rate (OR) performance.

Starting with the Property Audit report, Property A has an OR of 8.99% – this is very low. Property B has an OR of 31.83% – this is quite high. The OR range between these properties is very drastic. Let’s look a little deeper at Property A and Property B.

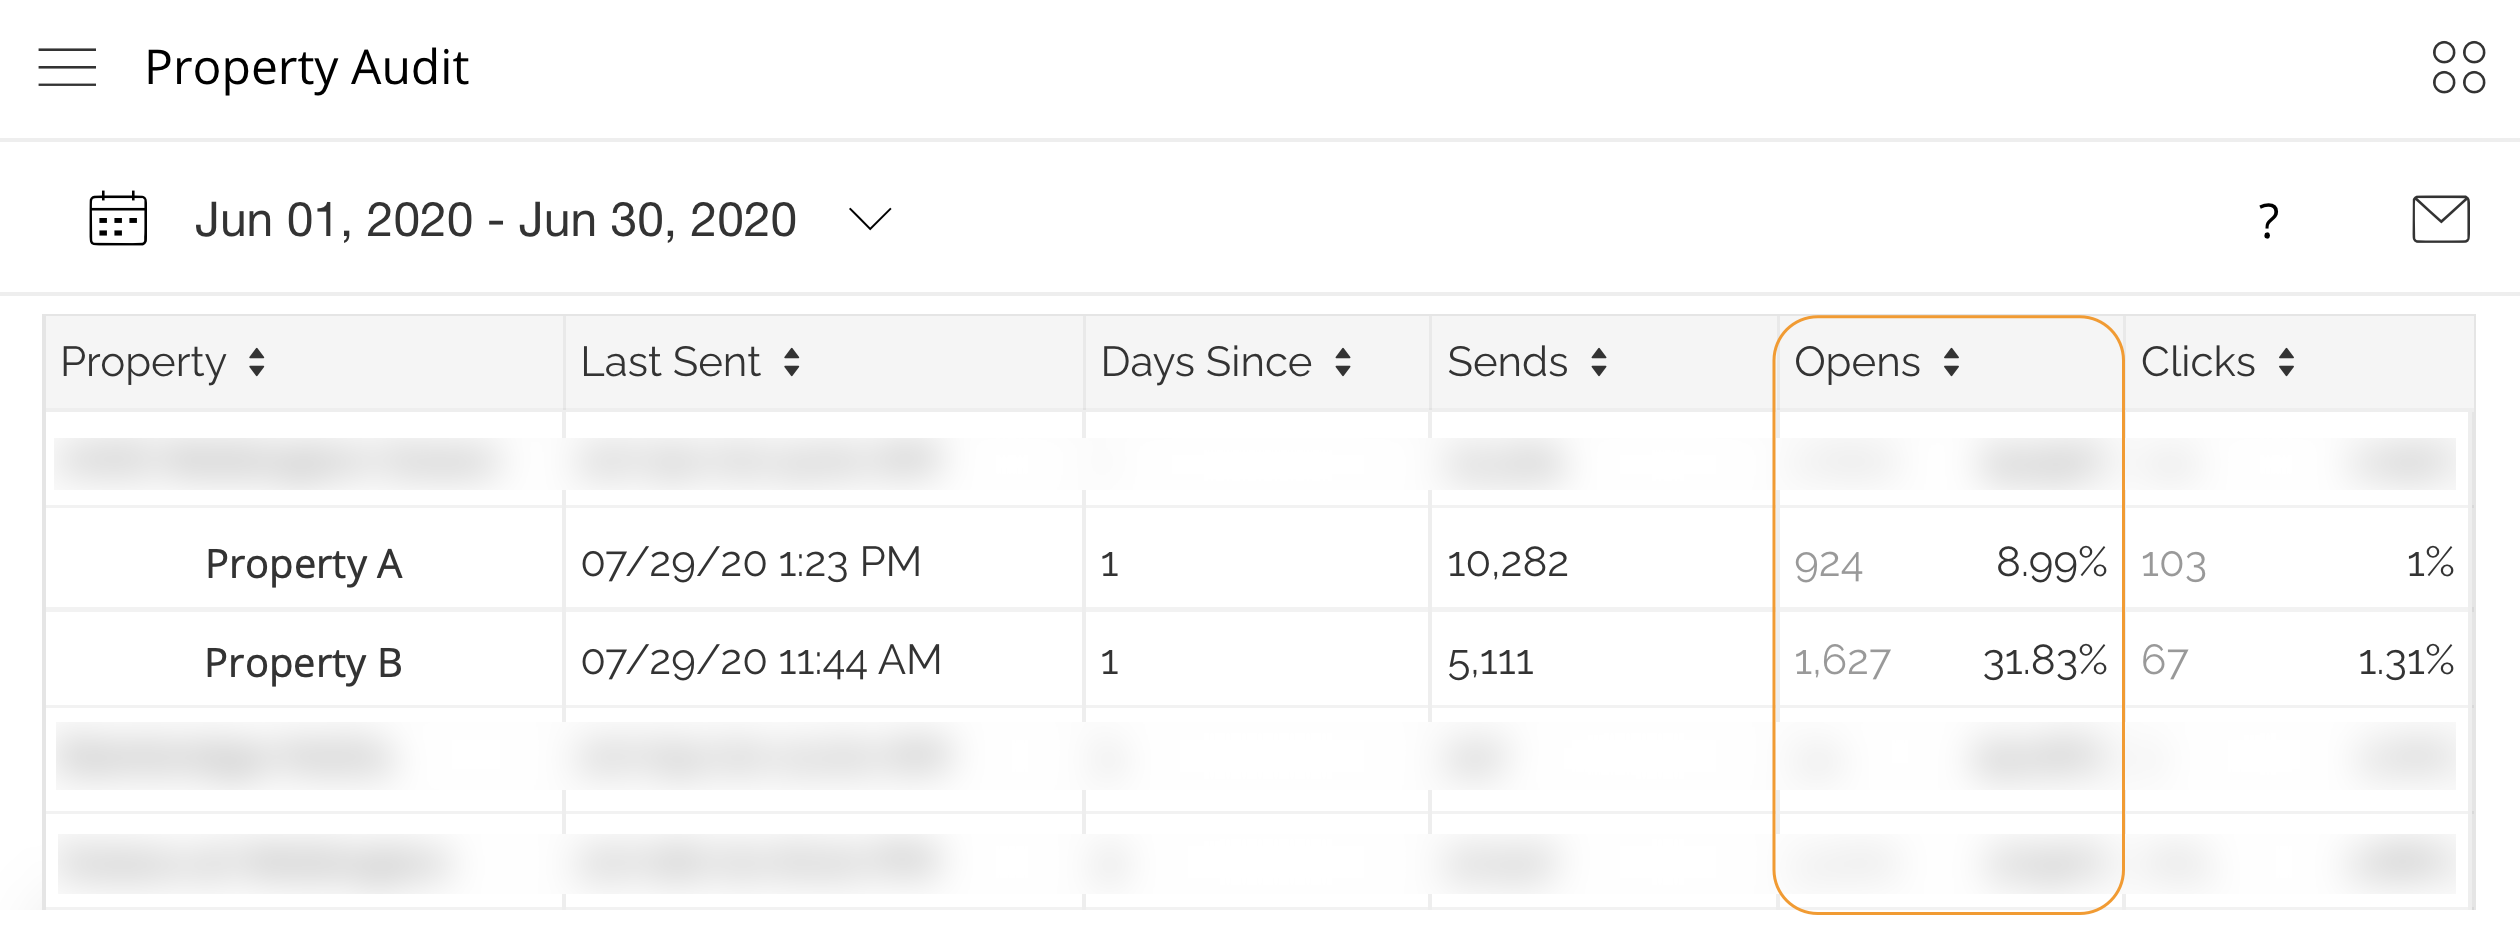
When looking at the Property eBlast, you see Property A sent a total of 9 eBlasts in the month of June while Property B sent 6 eBlasts. Property A’s average OR was 8.95%. Property B’s average OR was 31.01%. Both properties primarily sent Offers.

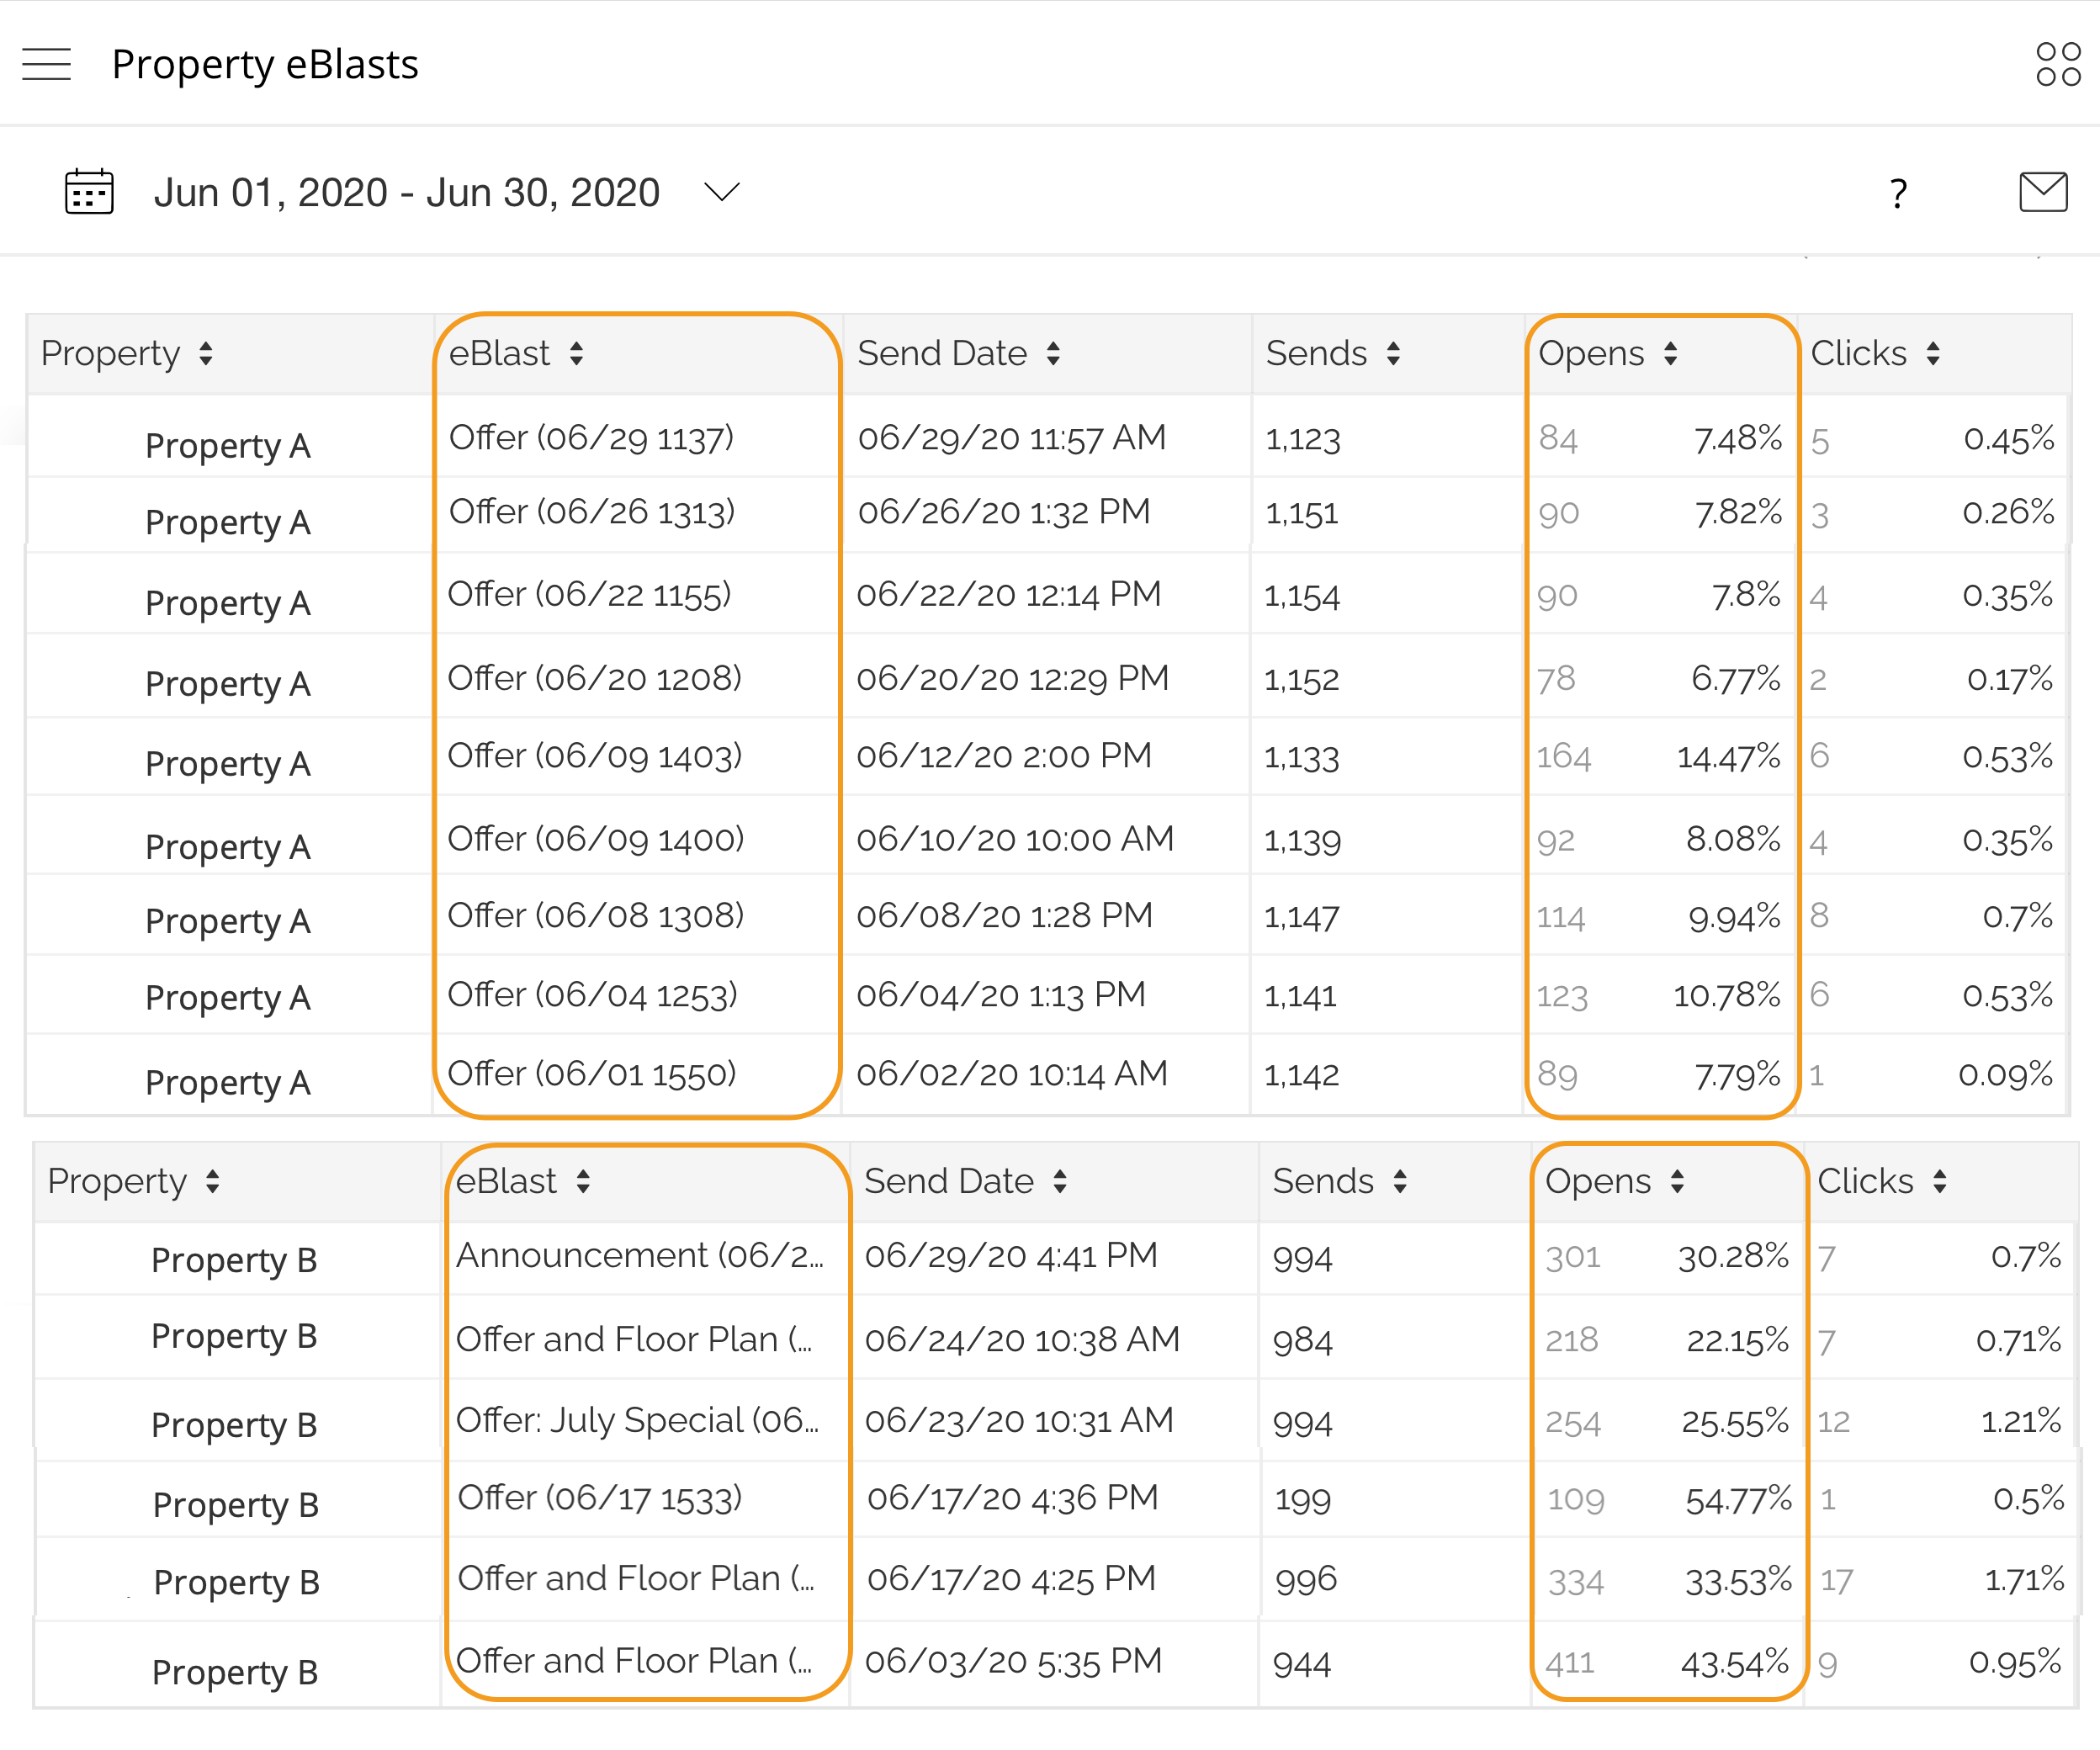
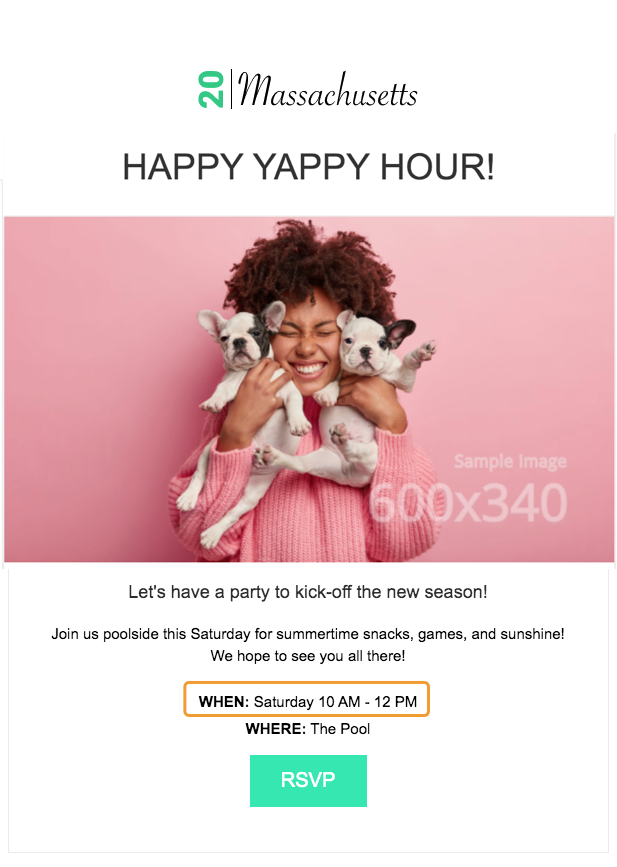
Below you see individual eBlast campaign reports from Property A and Property B. Note the subject lines and OR for both.

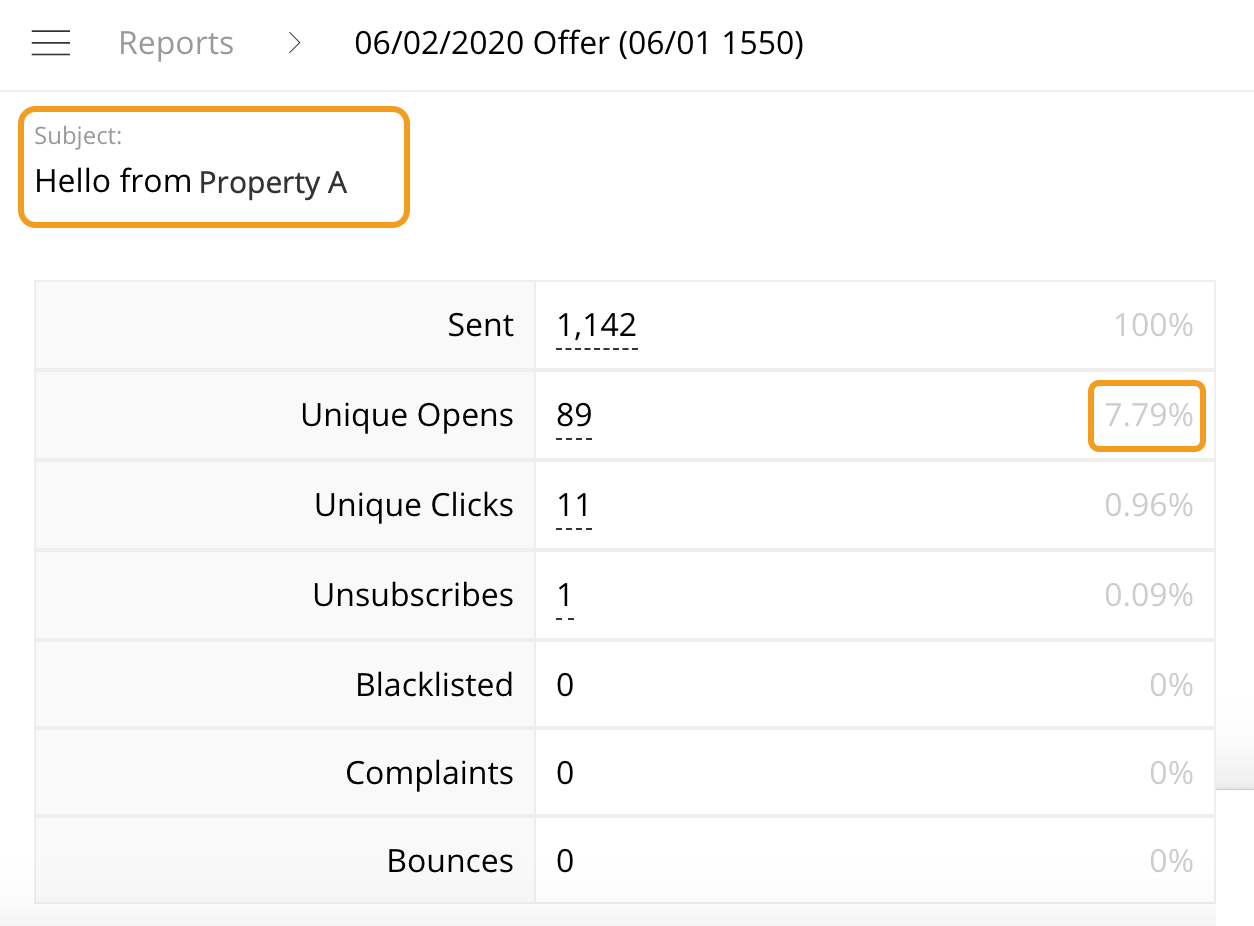
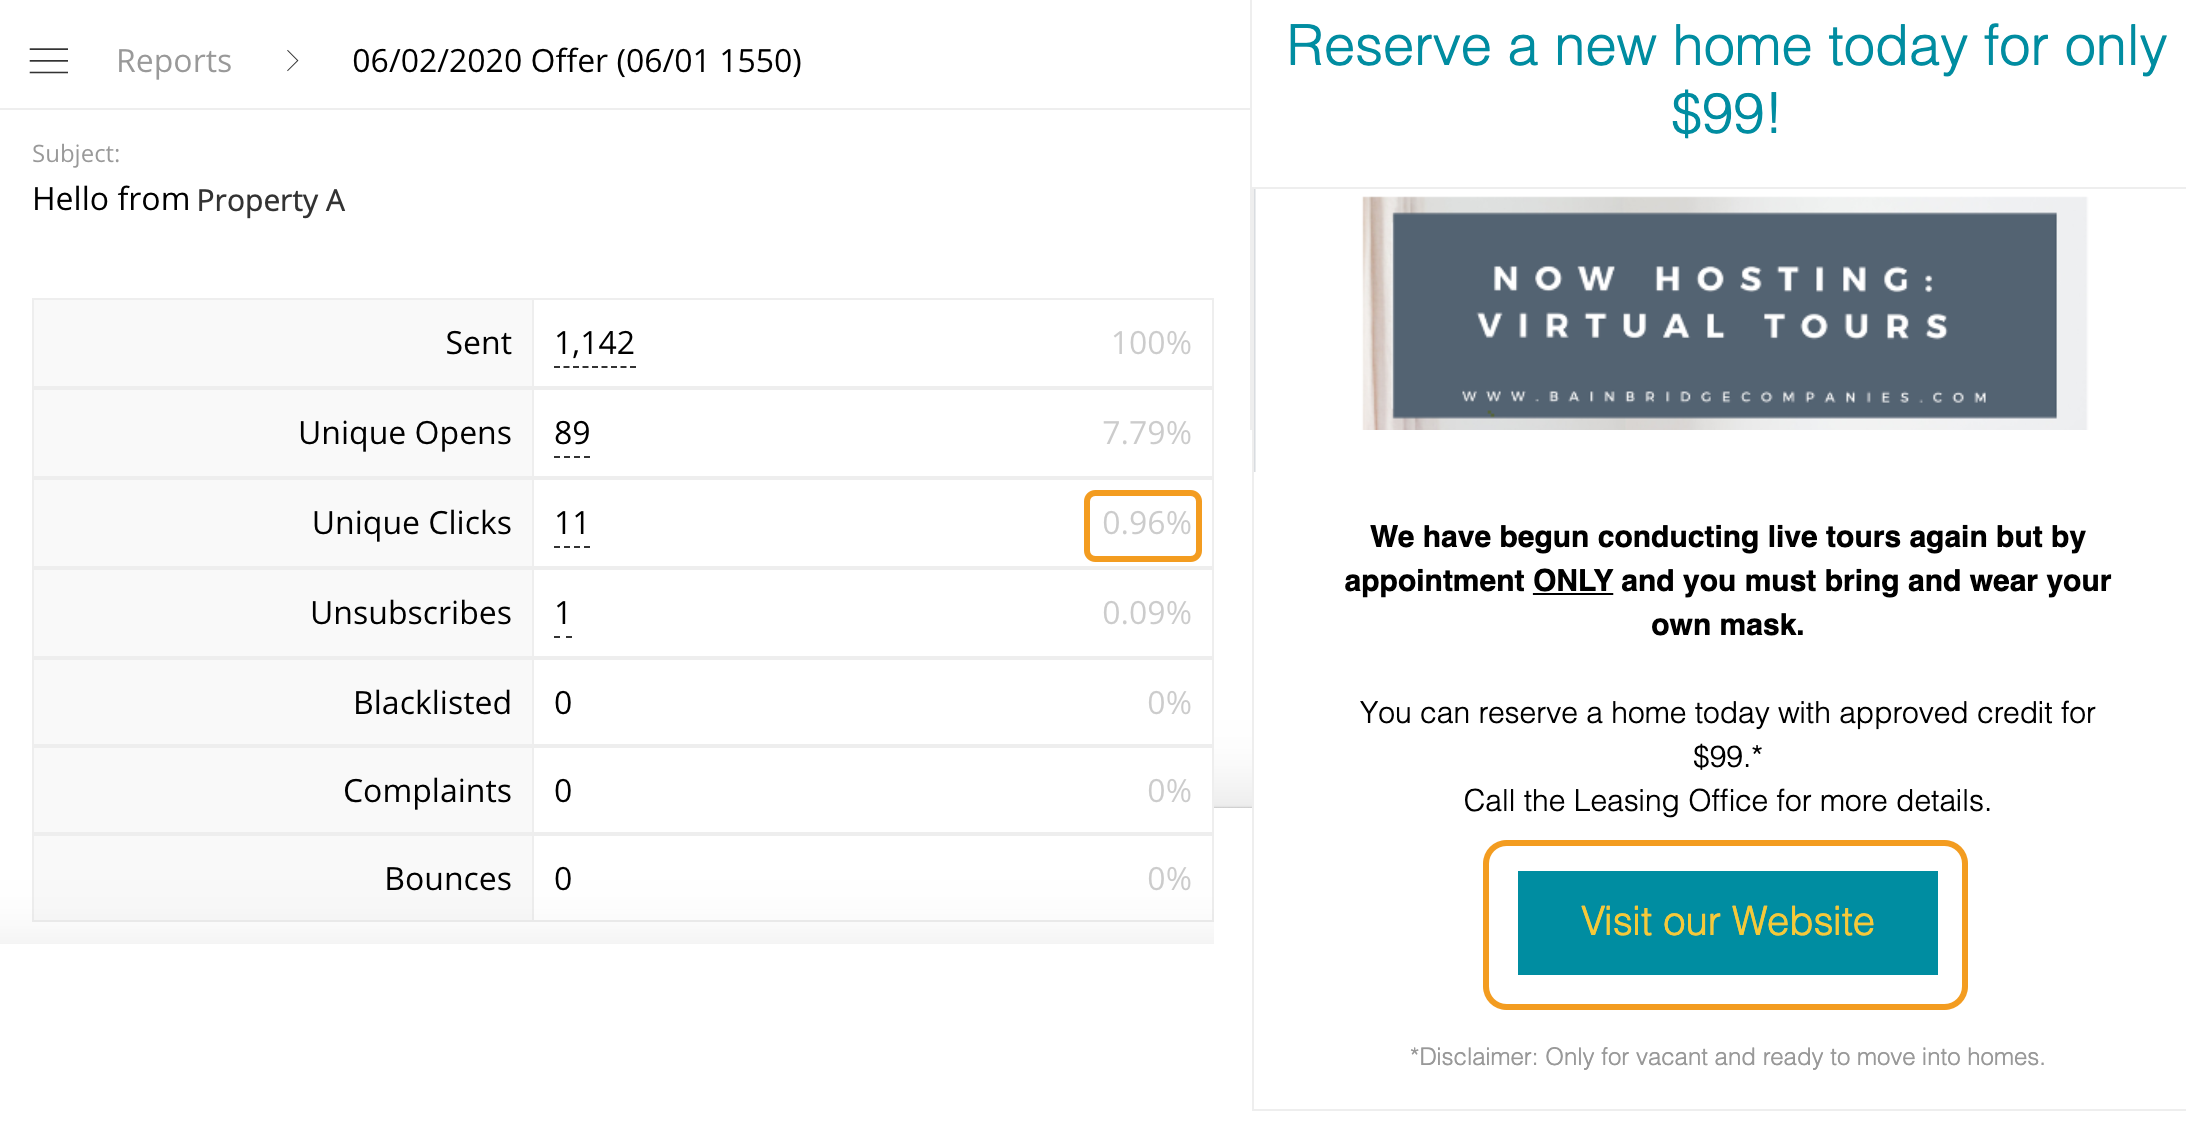
Property A’s subject line: ‘Hello from Property A’ and an OR of 7.79%

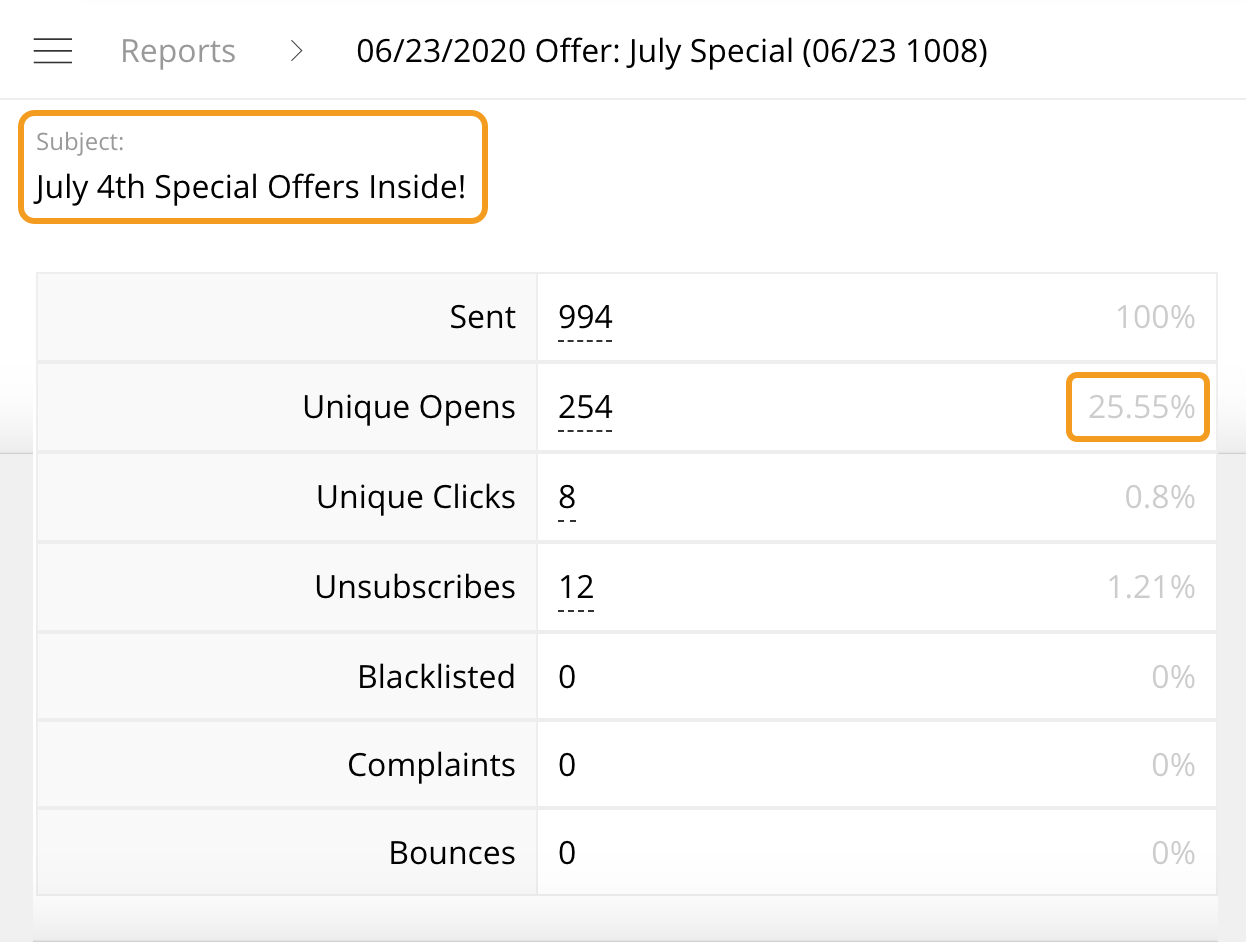
Property B’s subject line: ‘July 4th Special Offers Inside!’ and an OR of 25.55%.

Undoubtedly, subject lines impacted the OR of these two campaigns. Property A’s subject line is generic. It does not indicate the content of the eBlast, nor does it excite the user.

Property B’s subject line is far more engaging. It is more energetic and gives insight into the eBlast’s content. Additionally, the property chose to target the subject line around the upcoming July 4th holiday. Despite the lack of eBlast variety, in that both properties primarily sent Offers, the engaging subject lines improved Property B’s OR.


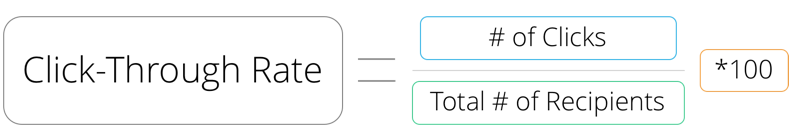
Optimizing Click-Through Rate

Similar to OR, Click-Through Rate (CTR) can also be improved through data.

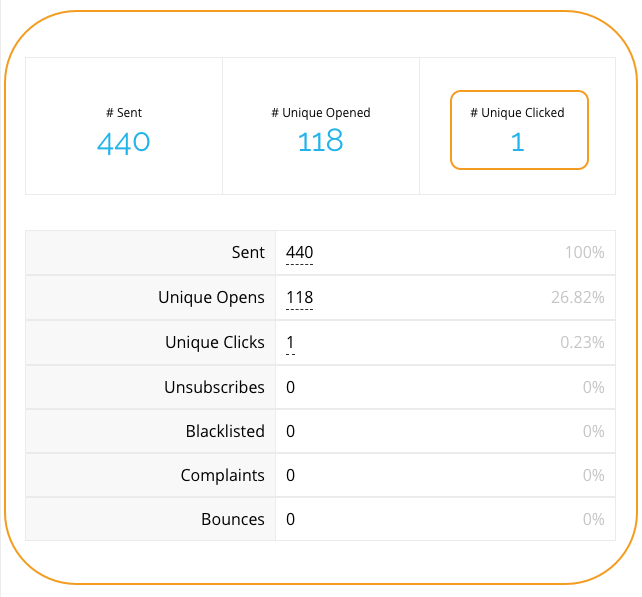
In addition to having the lowest OR, Property A also had the lowest CTR at 1%. Property C had a CTR of 2.33%. Let’s compare Property A and Property C.

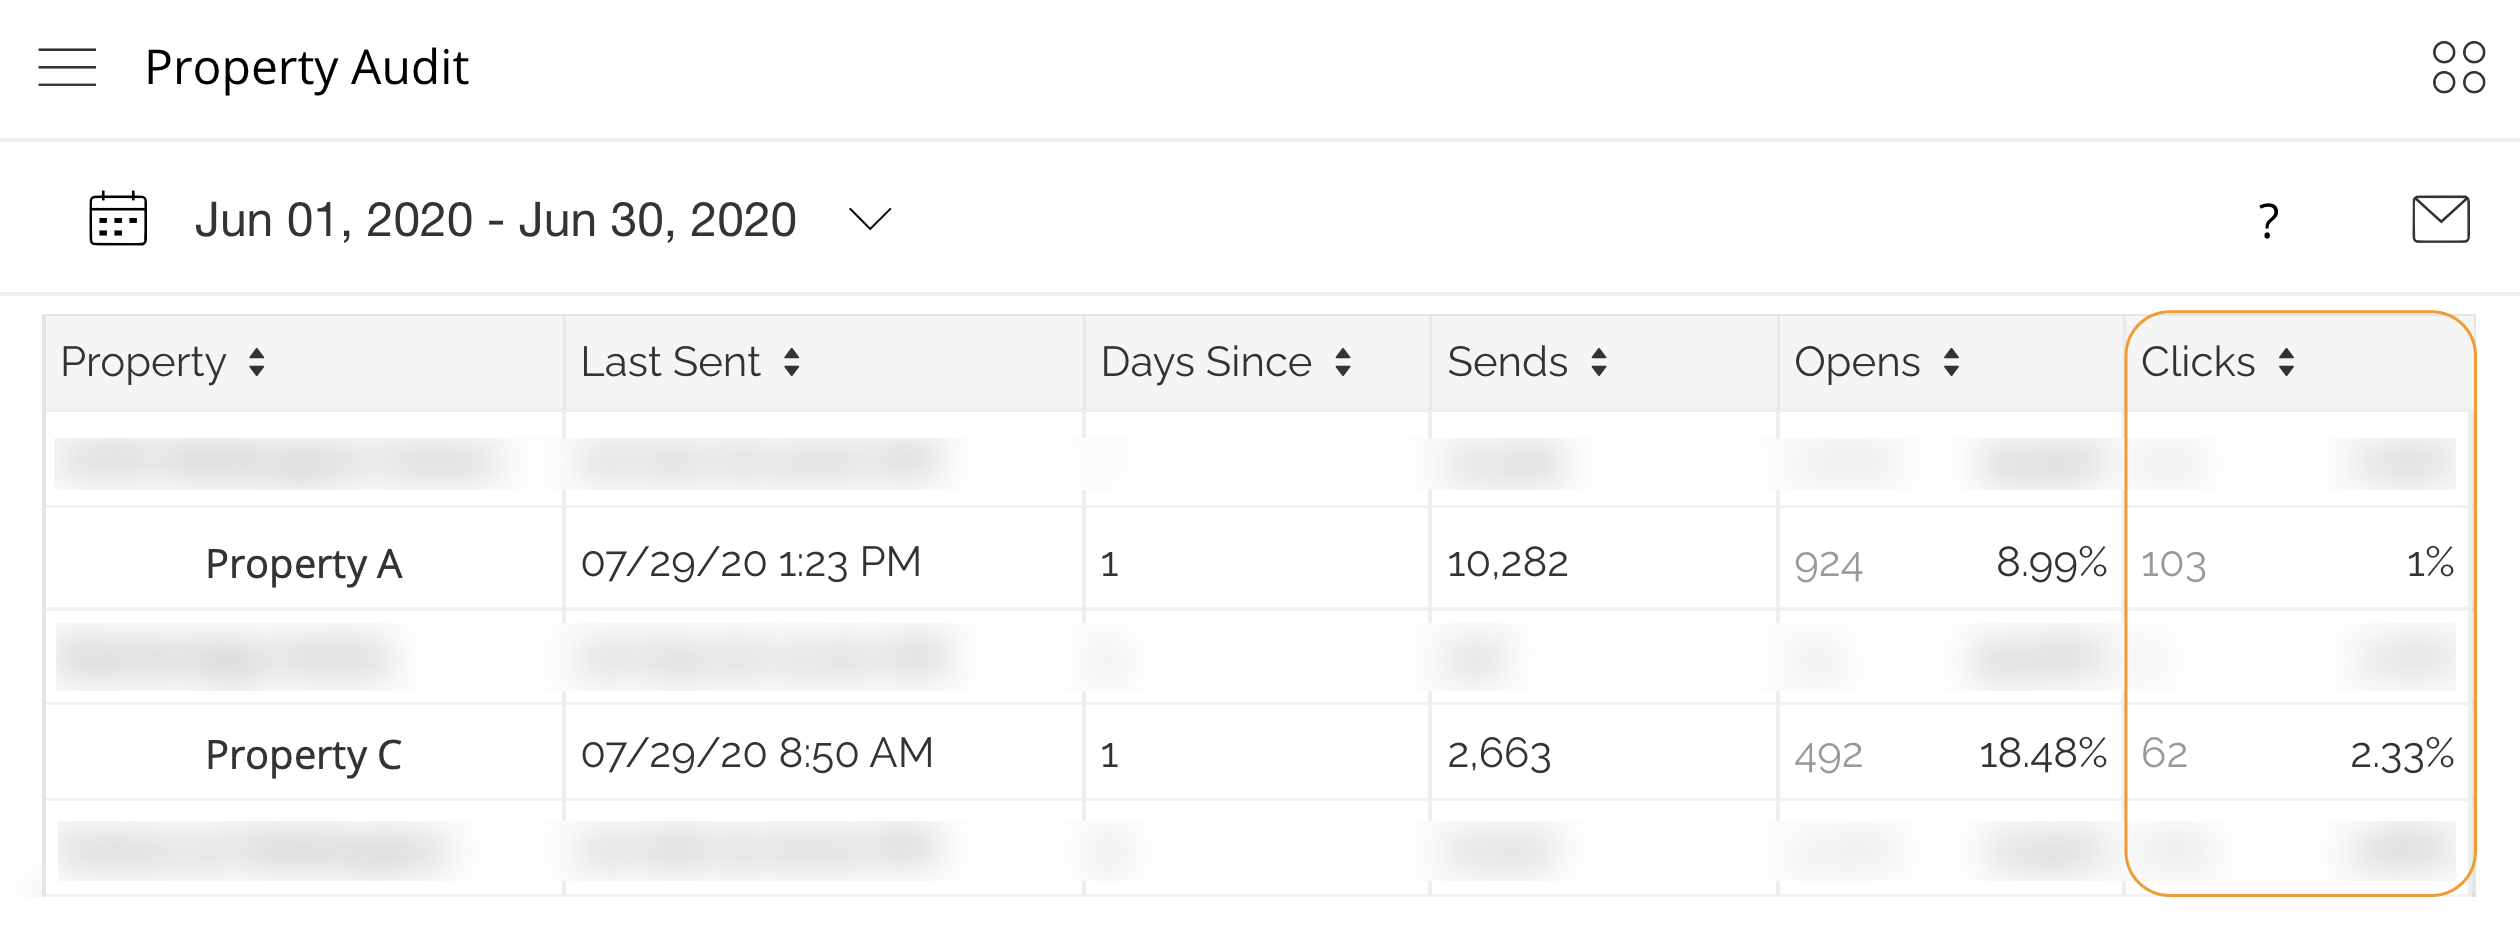
Again, Property A sent 9 eBlasts throughout June, while Property C only sent 4. Both properties only sent Offers. More importantly, is the CTRs of each campaign. None of Property A’s campaigns had a CTR higher than any of Property C’s campaigns.

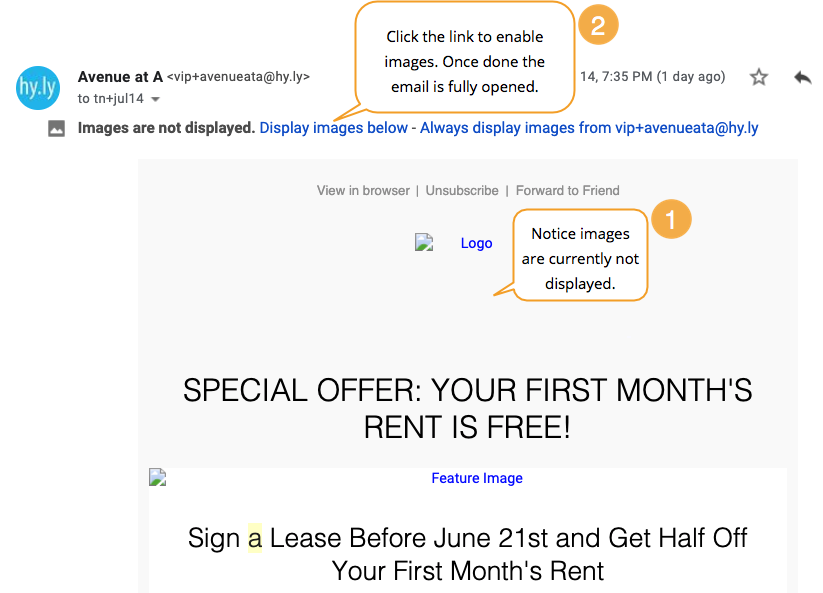
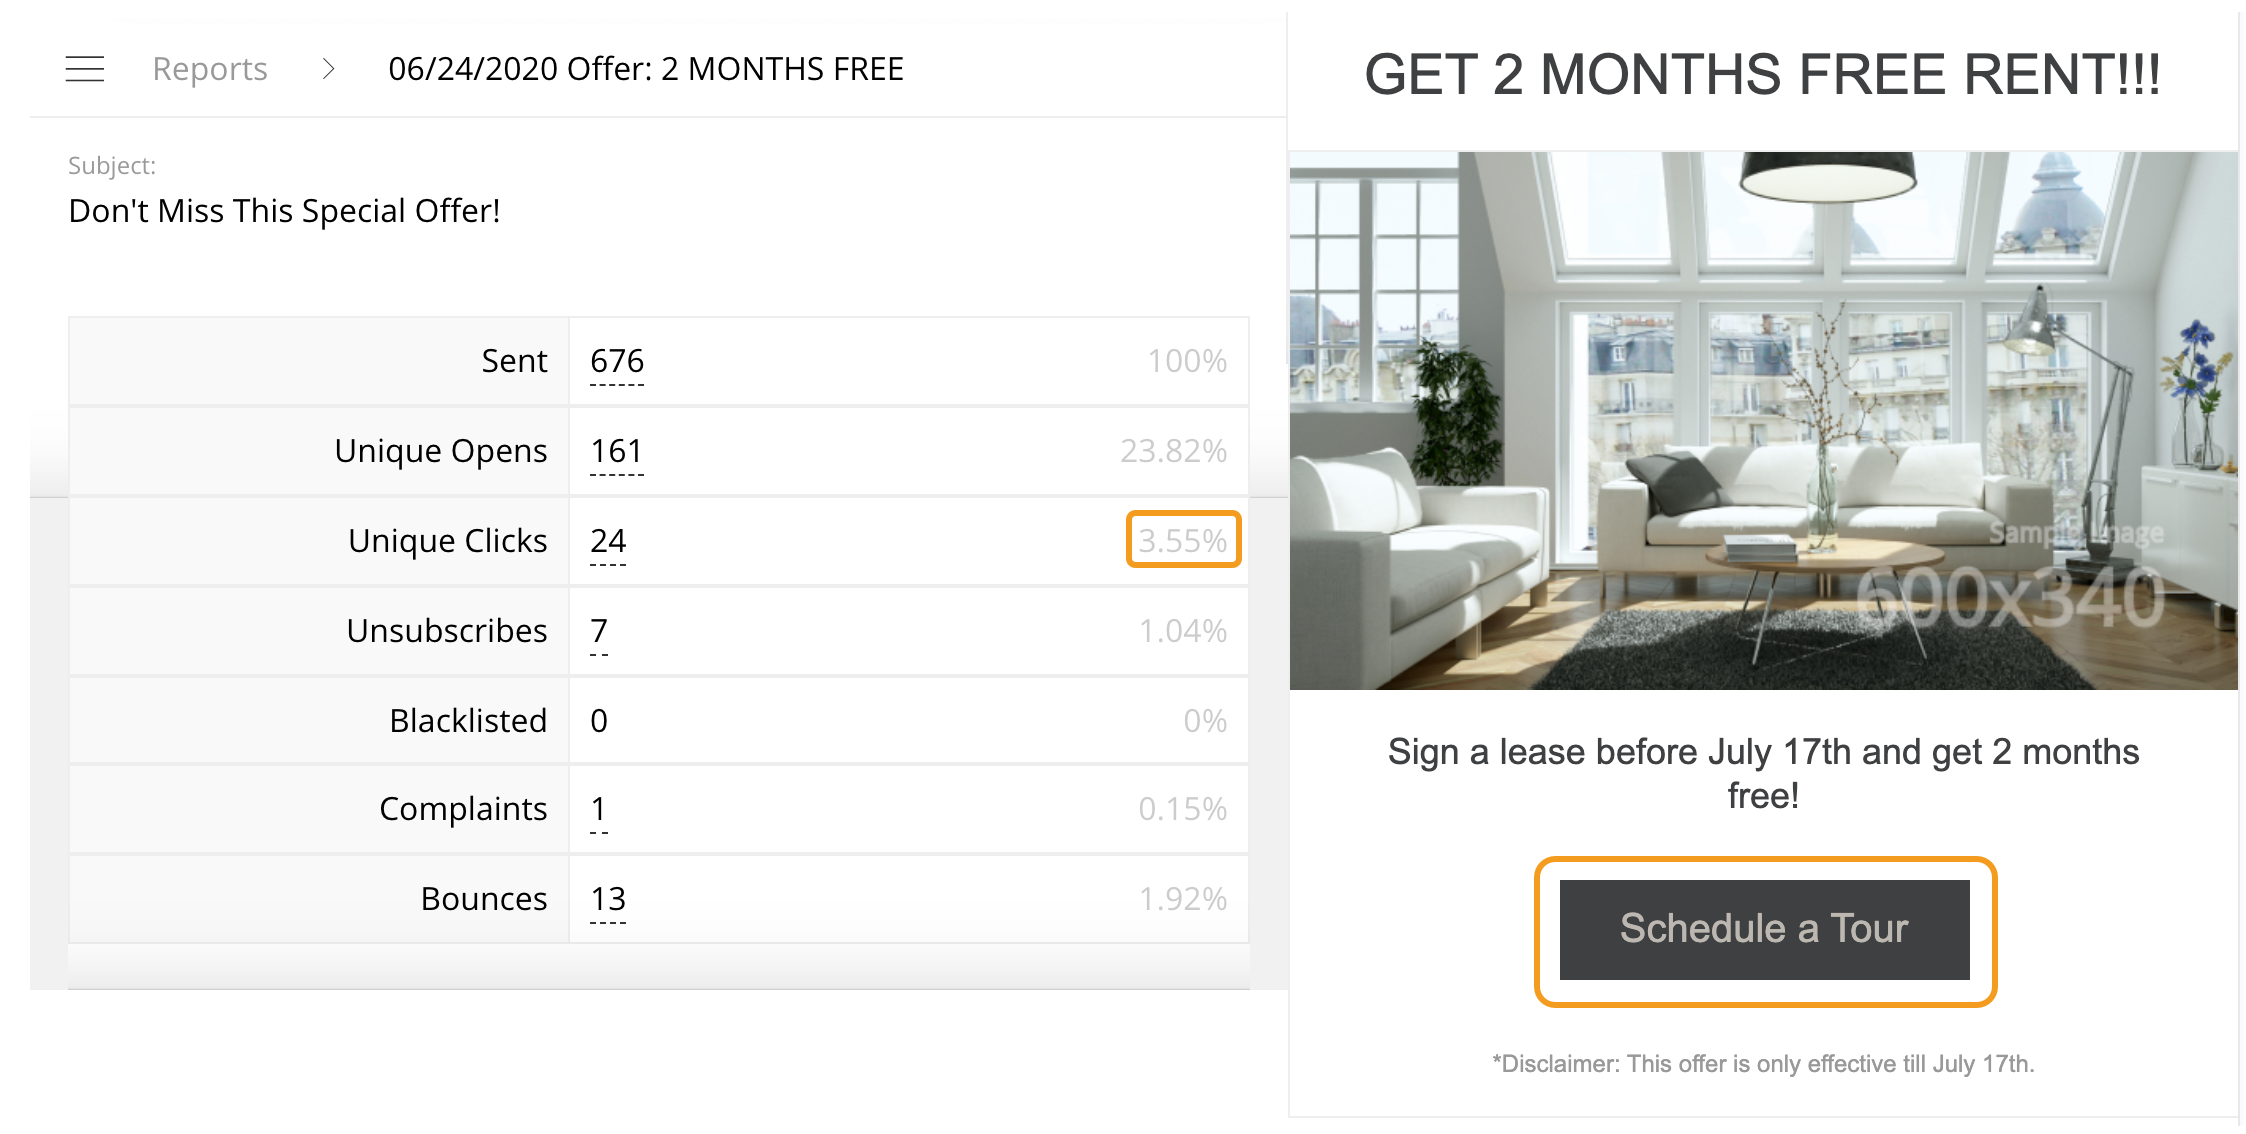
Let’s look at the individual eBlasts. Below you see two images for each property. On the left is the eBlast campaign report. On the right is an image of the eBlast.

Property A’s campaign has a CTA that reads ‘Visit our Website’ with a CTR of 0.96%.

Property C’s eBlast has a CTA that reads ‘Schedule a Tour’ with a  CTR of 3.55%.

Between both properties, it is clear which campaign was more cohesive. Property A’s CTA has no real relevance to the goal of the eBlast, which, based on the content, is to get prospects to schedule a virtual tour. Simply changing the CTA copy to be more relevant to the goal of the message would greatly improve the CTR.

Property C on the other hand closely relates their CTA and message content. Each field discusses an offer and how the prospect can take advantage of it. Finally, the CTA prompts the prospect to tour. All fields correspond, the eBlast is image-centric, and the CTA relates to the goal of the eBlast.

Optimizing Send Frequency

The final metric to consider is the number of unsubscribes. This metric strongly correlates with send frequency. Below you see the Property eBlast report for all properties.

Let’s look at the send frequency between Property B and Property C.

Property B had a total of 52 users unsubscribe during June and Property C had 21.

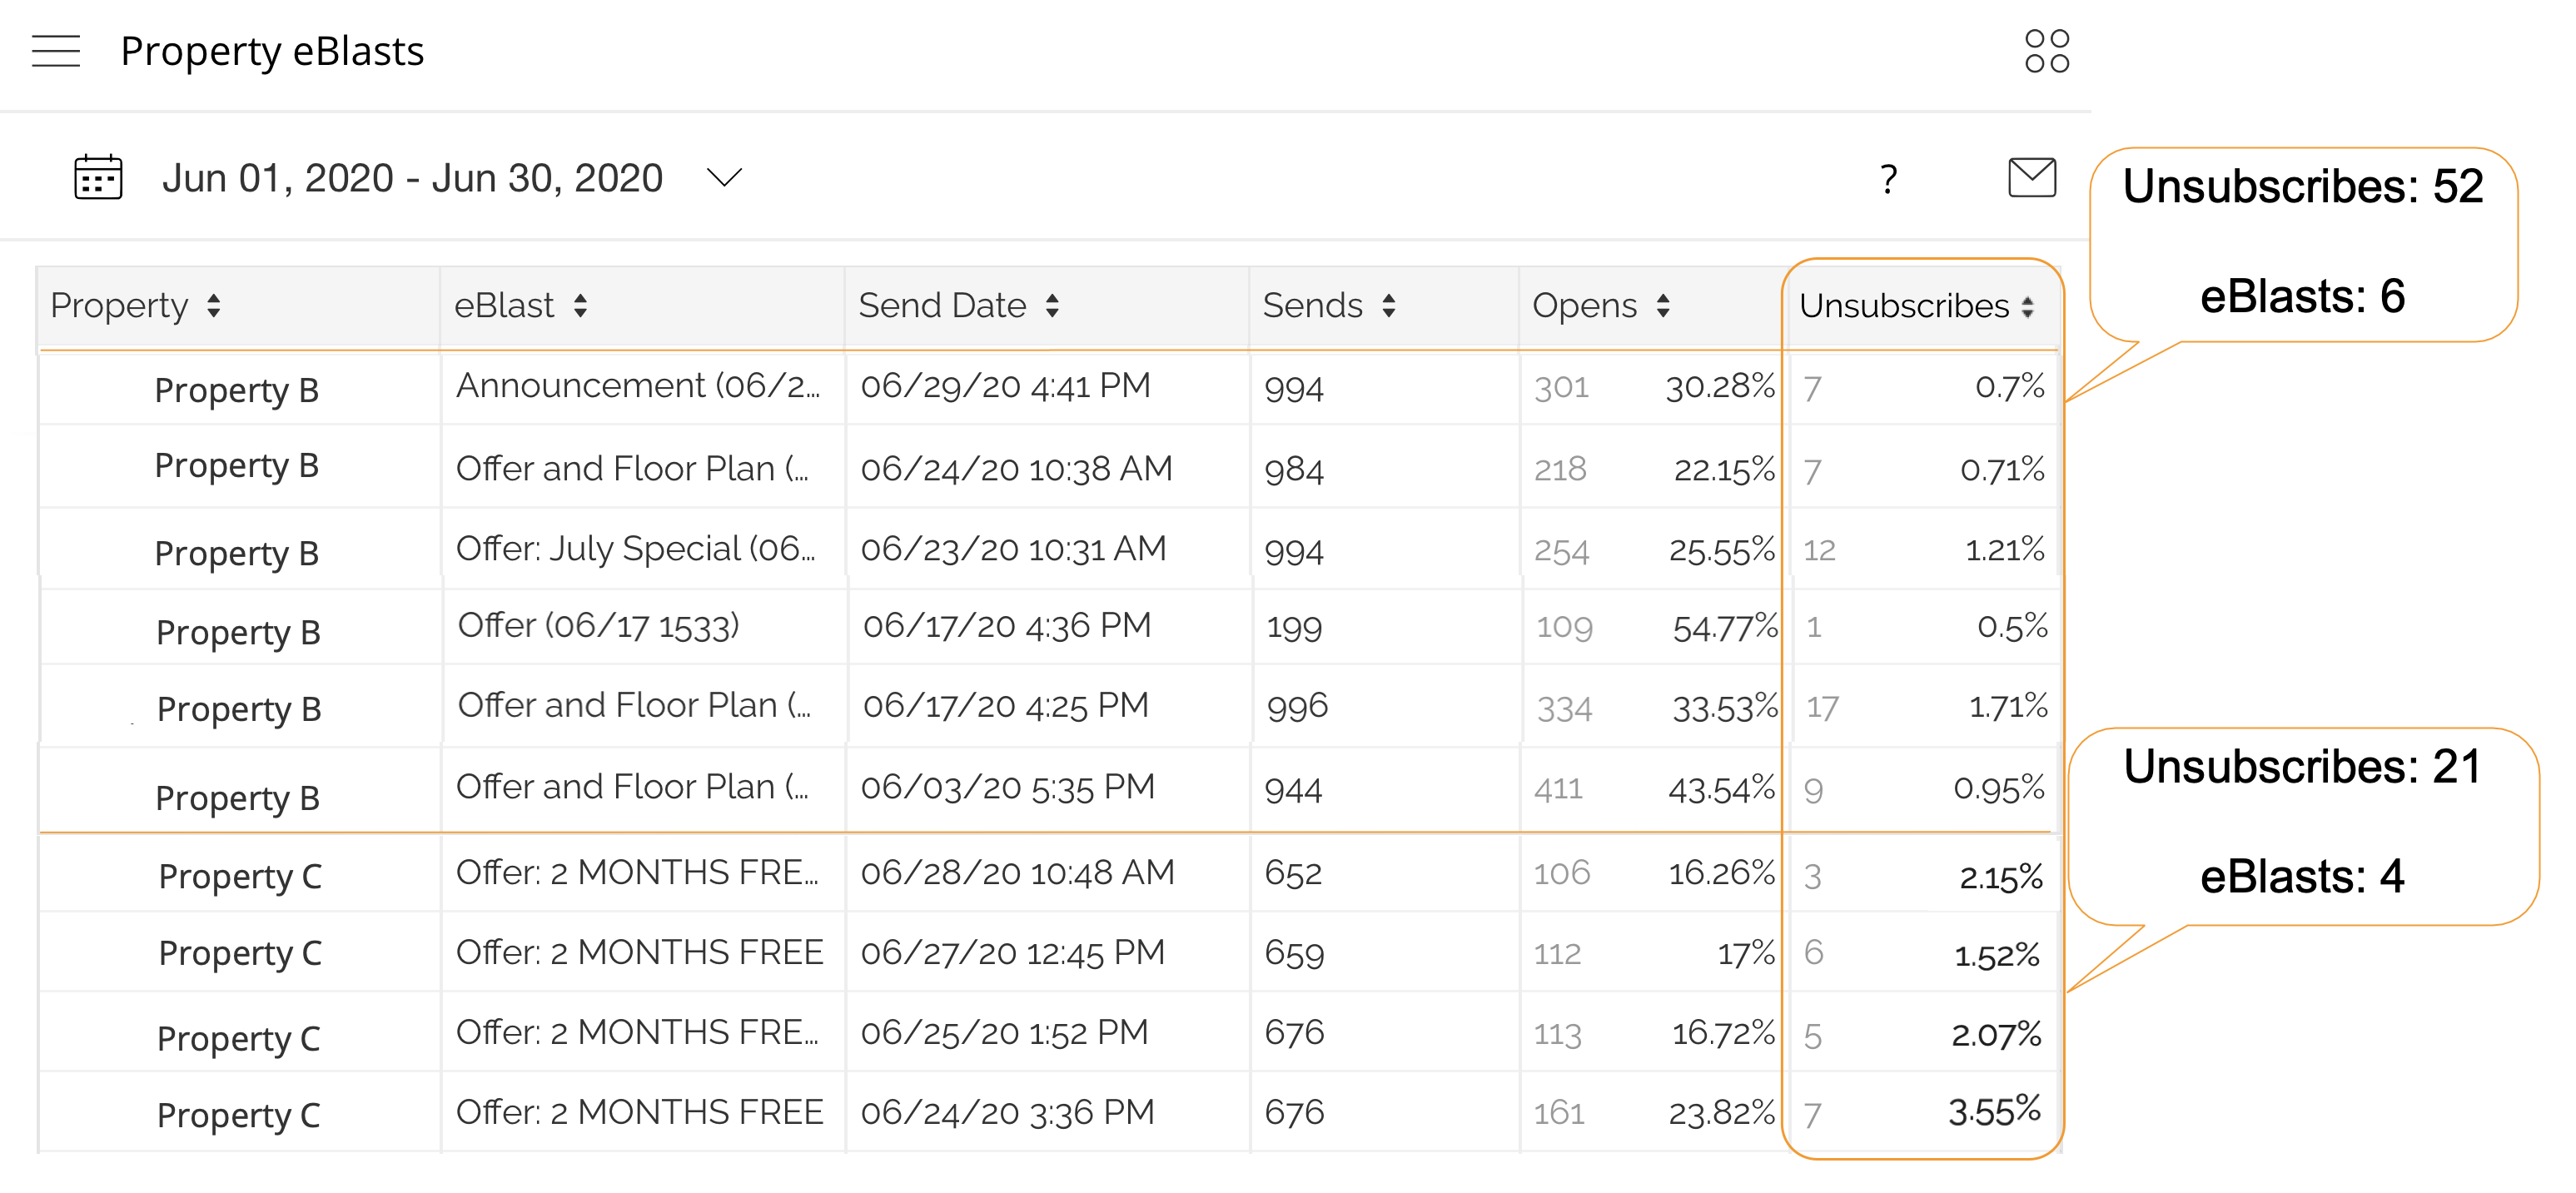
Property B’s unsubscribe rate was significantly higher than Property C’s. Property B sent 6 eBlasts over 27 days. Property C sent 4 eBlasts over 5 days. Property B’s higher send frequency prompted a lower CTR.

Optimization Wrap Up

Ultimately, all of these metrics influence each other.

OR is dependent on engaging subject lines that give the user some insight into the context of the email. It is also important to send a variety of email types–not just Offers. Both variables will improve OR.

CTR is highly dependent on strong CTA copy and message cohesiveness. When the subject line, message copy, and CTA copy all relate CTR will be much higher.

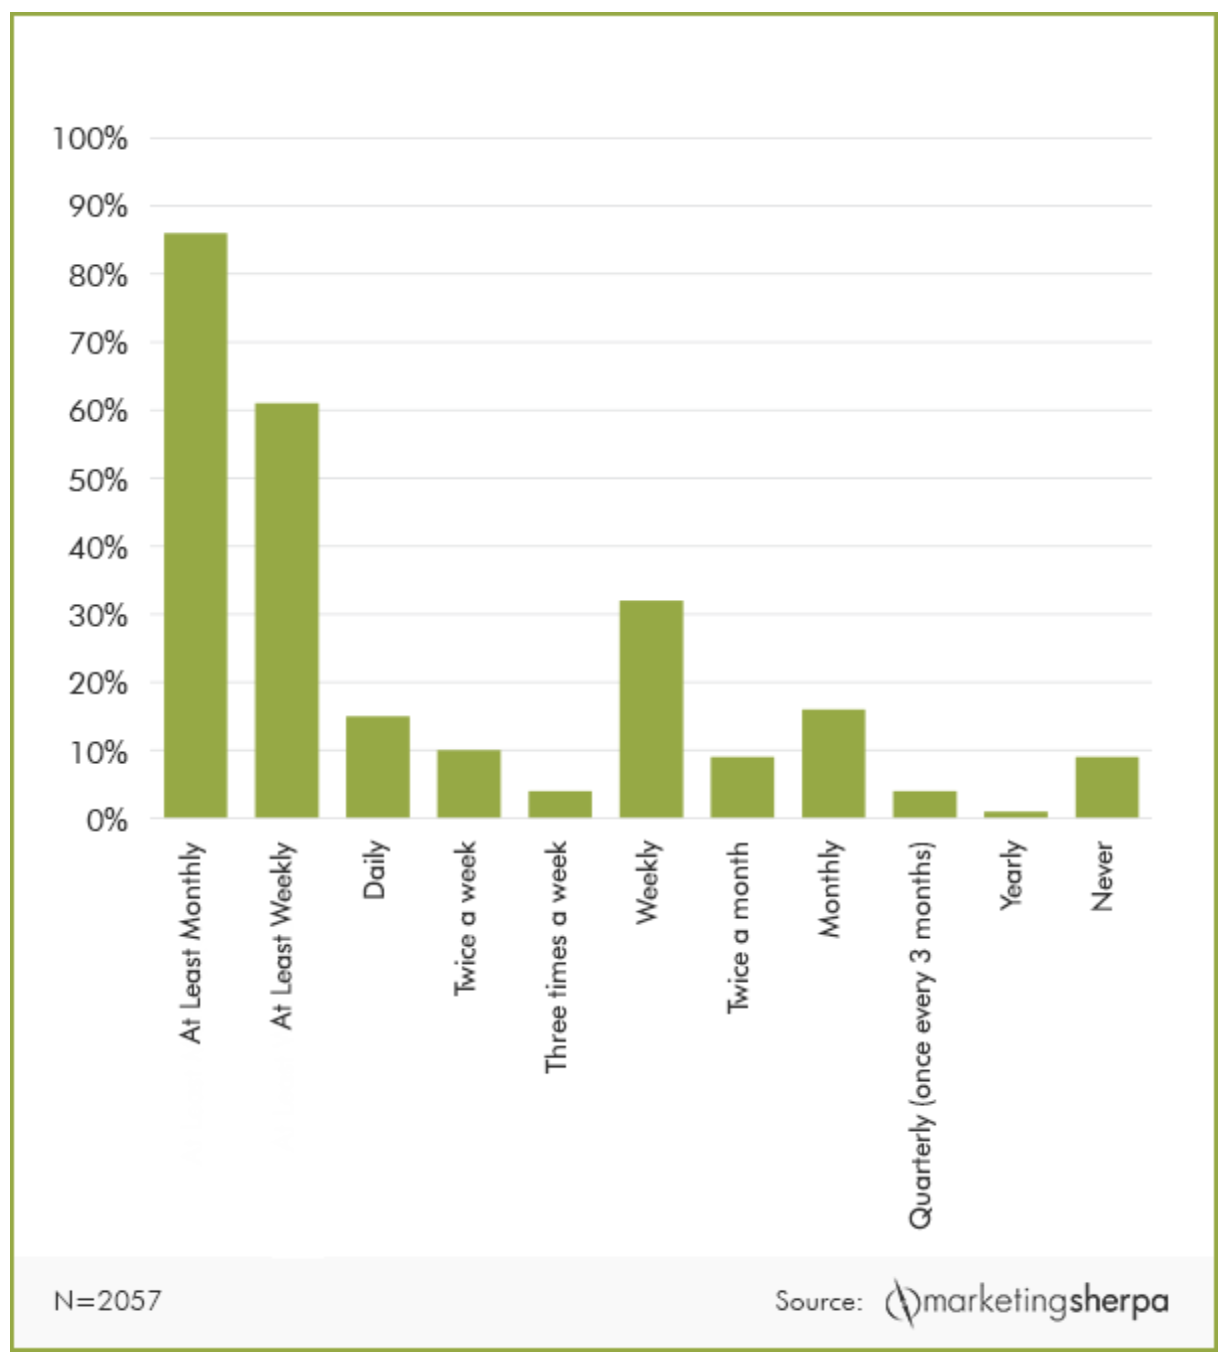
Finally, frequency matters. Not only do you want the content to relate but it is crucial that you have a consistent, yet conservative send frequency. In multifamily, the ideal frequency is 1-2 times a week. Any more than that you risk higher unsubscribe rates. Sending eBlasts less than 1-2 times a week does not properly engage users.

Following these practices and regularly reviewing the data will transform an average property into a top performer.

Learn More

Learn More

To learn more about hyMail Blasts reporting and how you can improve email performance, review our Knowledge Base.

For additional questions, give us a call: 516-HYLY-INC OR submit a ticket.